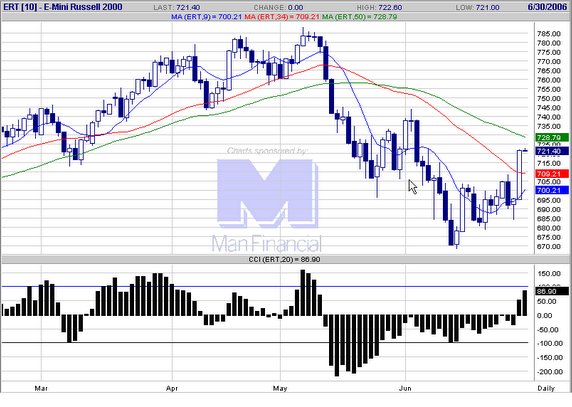
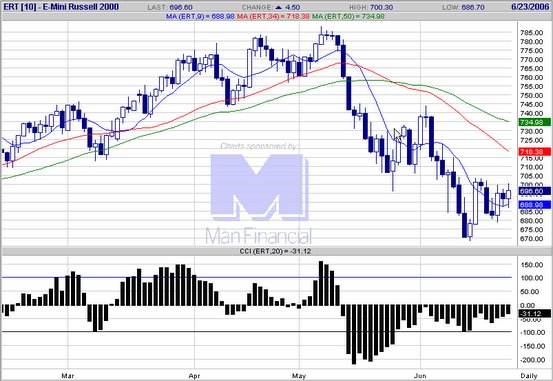
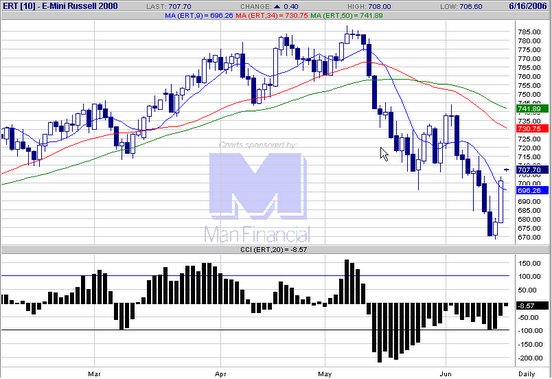
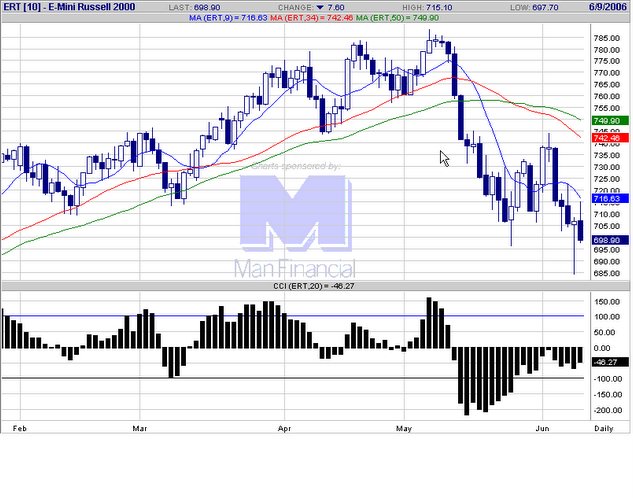
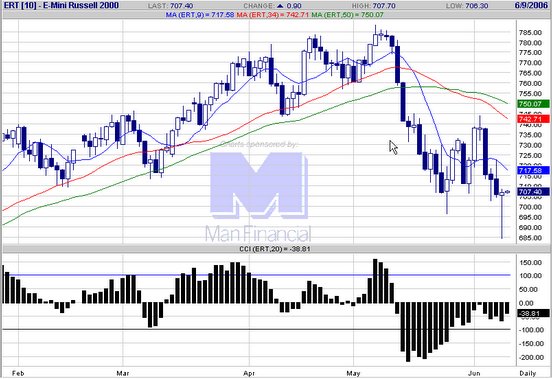
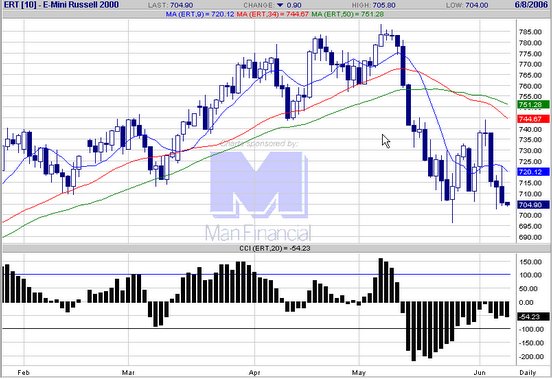
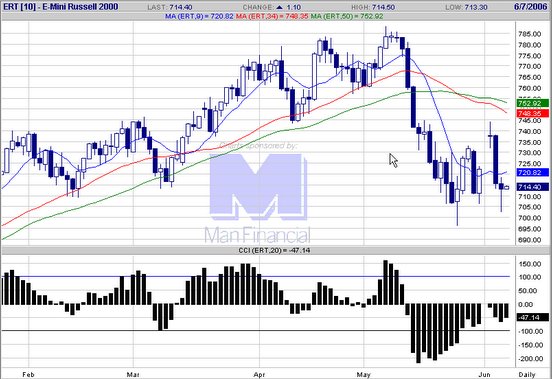
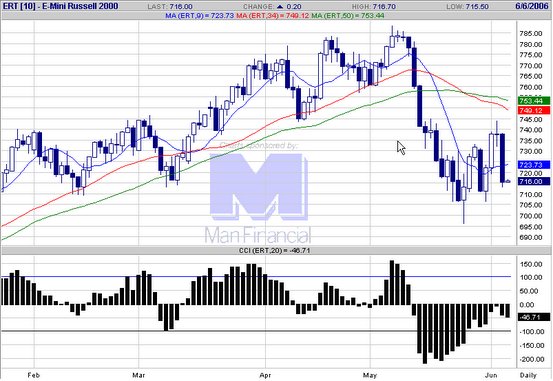
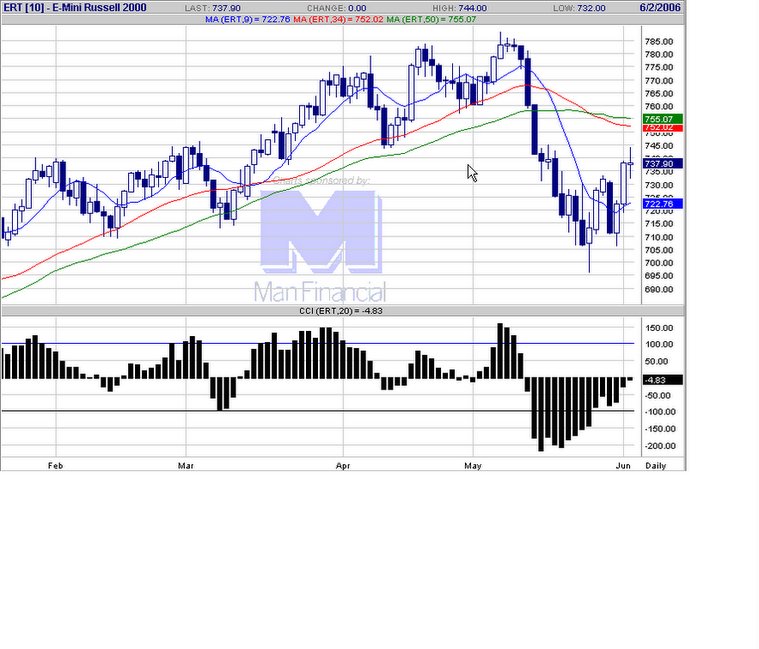
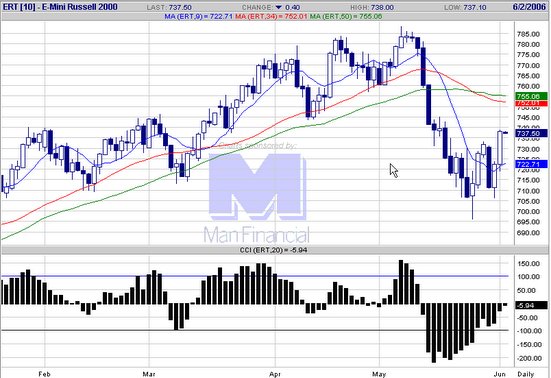
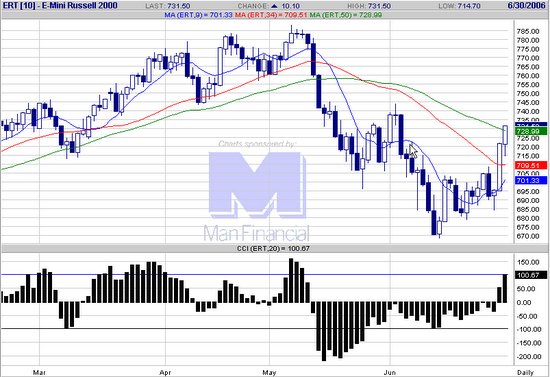
20060630 Russel has strong close, could be attributable to end of quarter trade. Our swing trade long entry did not eventuate, but may still set up next week. E-mini Russell 2000 chart
E mini Russell 2000 trading
Since 2004, the e-mini Russell 2000 futures has emerged as one of the favourite trading vehicle. It has advantages of providing cover and exposure to the small cap sector of the US equity markets, in addition to good volatility and intraday and interday trending characteristics. This educatinal site will chronicle trading in the contract.
Friday, June 30, 2006
Thursday, June 29, 2006
20060629 Strong impulse move up, coming off the hammer candlestick formation. Busts straight through our 713 level target. E-mini Russell 2000 chart
Wednesday, June 28, 2006
20060628 A hammer formation. Hopefully will propel the ER2 towards our target of 713. E-mini Russell 2000 chart
Tuesday, June 27, 2006
20060627 Could not sustain gains on way to test 709 (short of our 713 target). Today the candlestick pattern is dark cloud cover/engulfing bearish, a bearish pattern. 28/6 will be the start of the 2 day FOMC meeting. E-mini Russell 2000 chart
Monday, June 26, 2006
Saturday, June 24, 2006
20060623 A possible 123 continuation pattern, might see Russell continue on the rebound. E-mini Russell 2000 chart
Wednesday, June 21, 2006
Tuesday, June 20, 2006
Monday, June 19, 2006
20060619 Engulfing bearish/dark cloud cover formation. Should be headed to retest the lows. E-mini Russell 2000 chart
Thursday, June 15, 2006
Wednesday, June 14, 2006
20060614 Capitulation rally comes. Seems 670 seems to be established as support. E-mini Russell 2000 chart
Tuesday, June 13, 2006
20060613 With support broke at 685, very little resistance on the path down today. E-mini Russell 2000 chart
Monday, June 12, 2006
20060612 Retests the low. Remains to be seen whether the support can hold. But the 'hammer' pattern failed, which says a lot on how clever people are nowadays with technicals. E-mini Russell 2000 chart
Friday, June 09, 2006
20060609 No continuation to confirm the hammer reversal. Price action doesn't look promising for rebound to continue, but needs to hold support at 685. E-mini Russell 2000 chart
Thursday, June 08, 2006
20060608 Russell shows a hammer, which is a bullish reversal signal. Looking for continuation for 2 to 3 days. E-mini Russell 2000 chart
Wednesday, June 07, 2006
Tuesday, June 06, 2006
20060606 Russell finds support at 705, key level. If it closes above today's high, a buy swing entry is indicated. E-mini Russell 2000 chart
Monday, June 05, 2006
20060605 Day of big losses for small caps after last Friday's surprising NFP data. Still has to break support levels, which might come tomorrow. CCI pattern is short ZLR. E-mini Russell 2000 chart
Friday, June 02, 2006
20060602 Emini Russell shows indecision,with balance between bulls and bears. Will have to see price action next week, whether CCI can break zero line reisstance. E-mini Russell 2000 chart
Thursday, June 01, 2006
20060601 Russell CCI pattern shows divergence triggered long, on 2nd consecutive day of gains. E-mini Russell 2000 chart