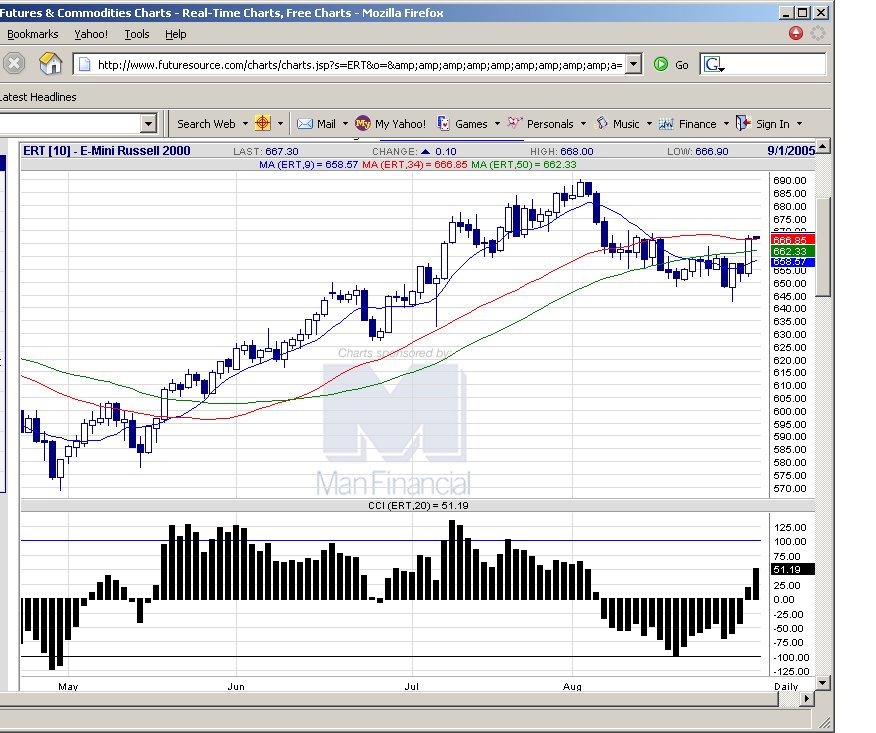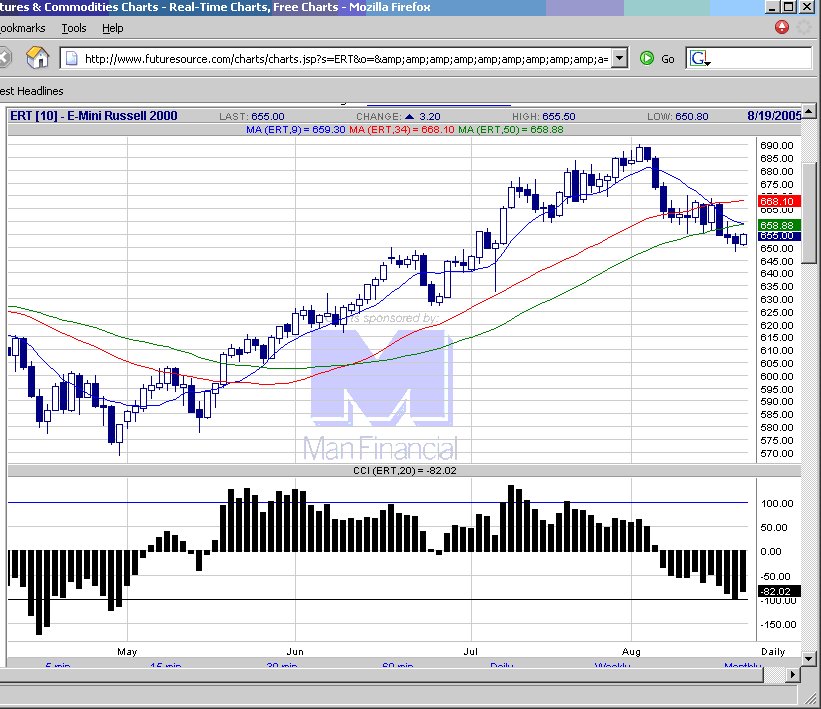
20050831 The expected breakout came on the upside, with good momentum. The setup was an ID (Inside Day) but the range was nt the narrowest of the last 4 days for Aug 30.
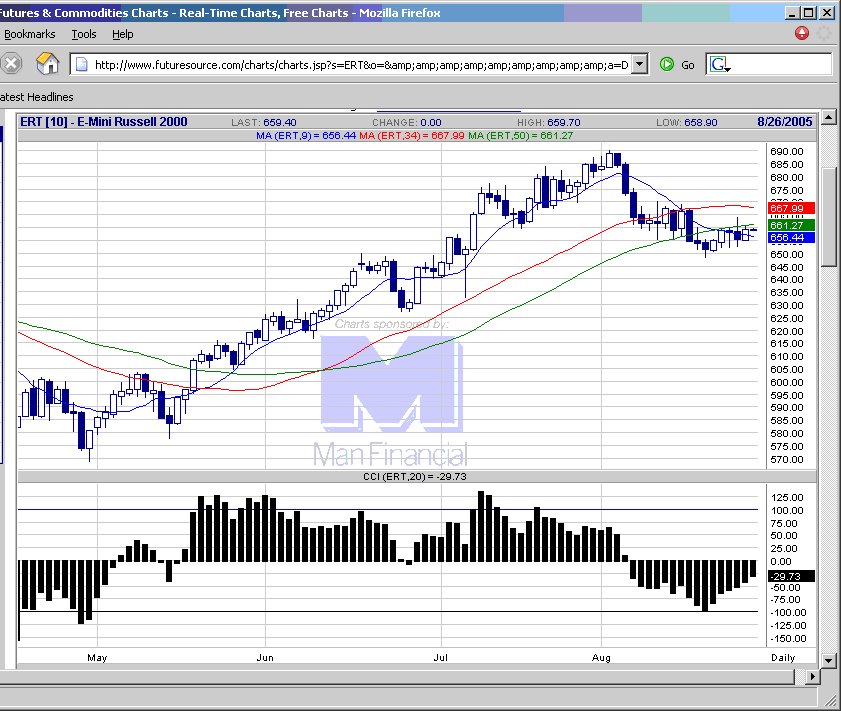
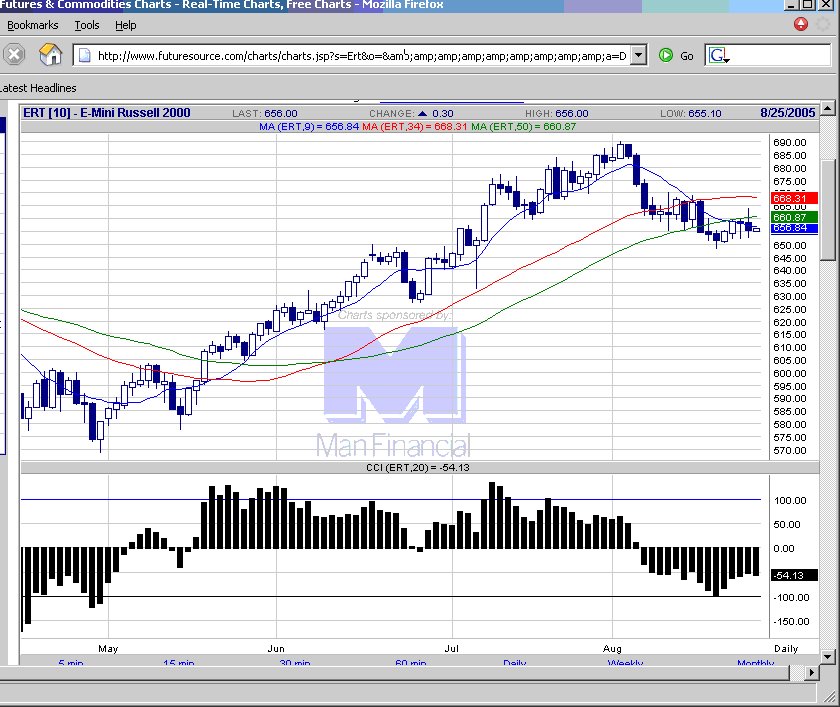
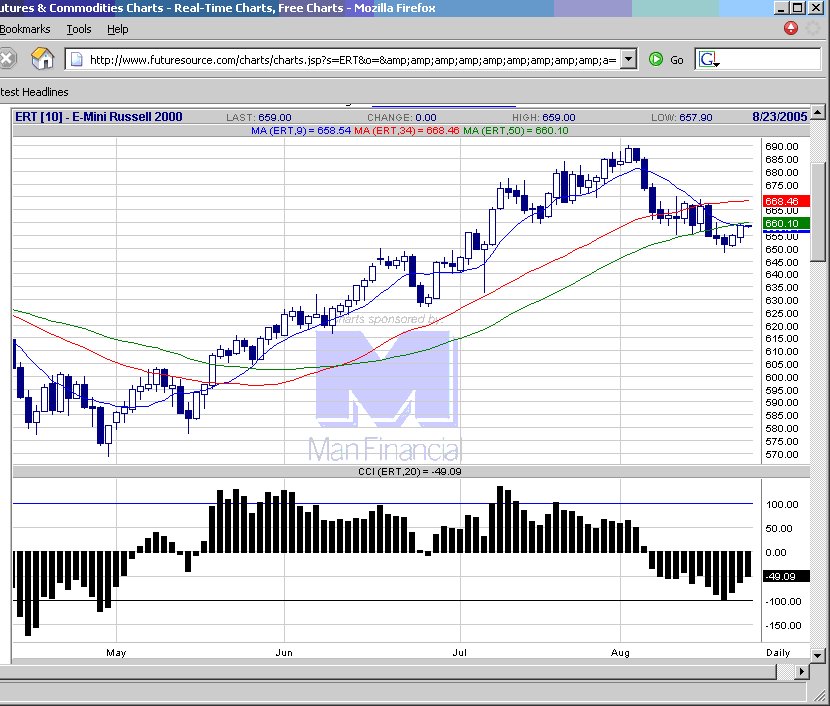
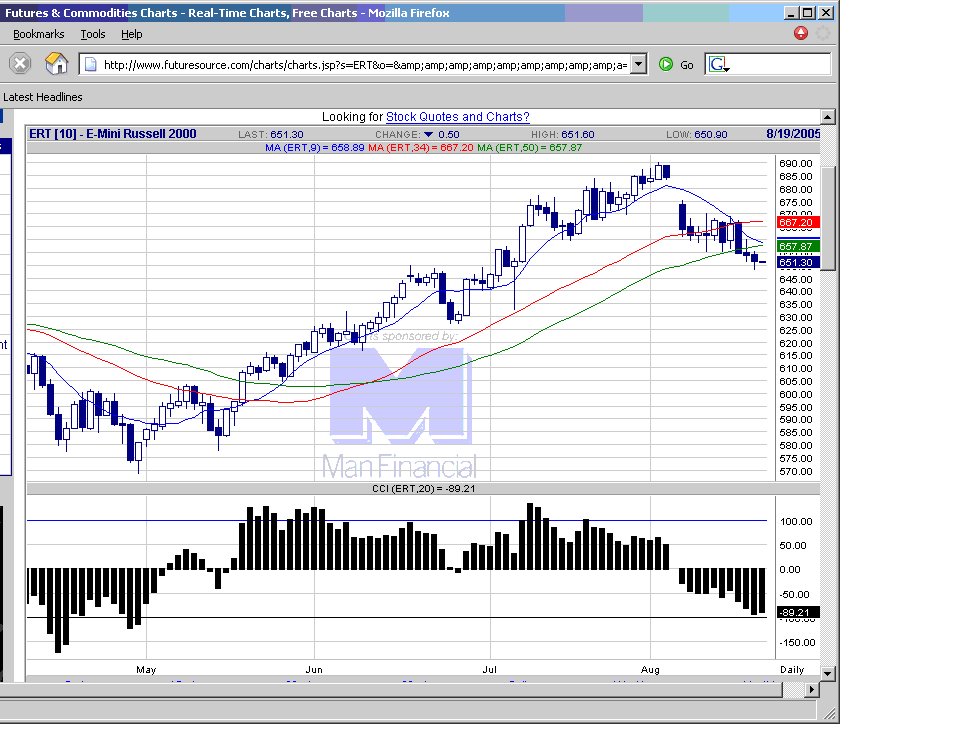
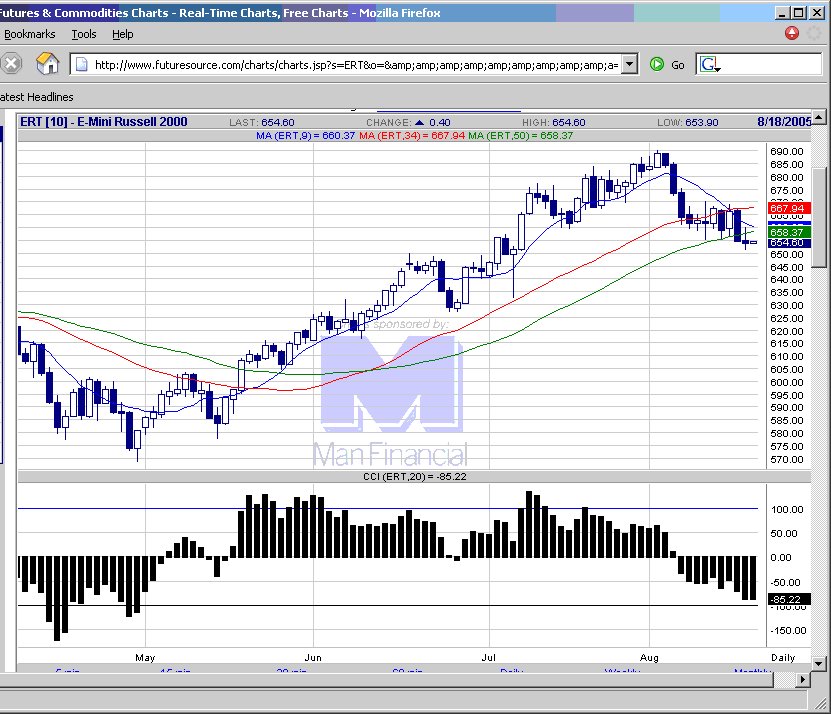
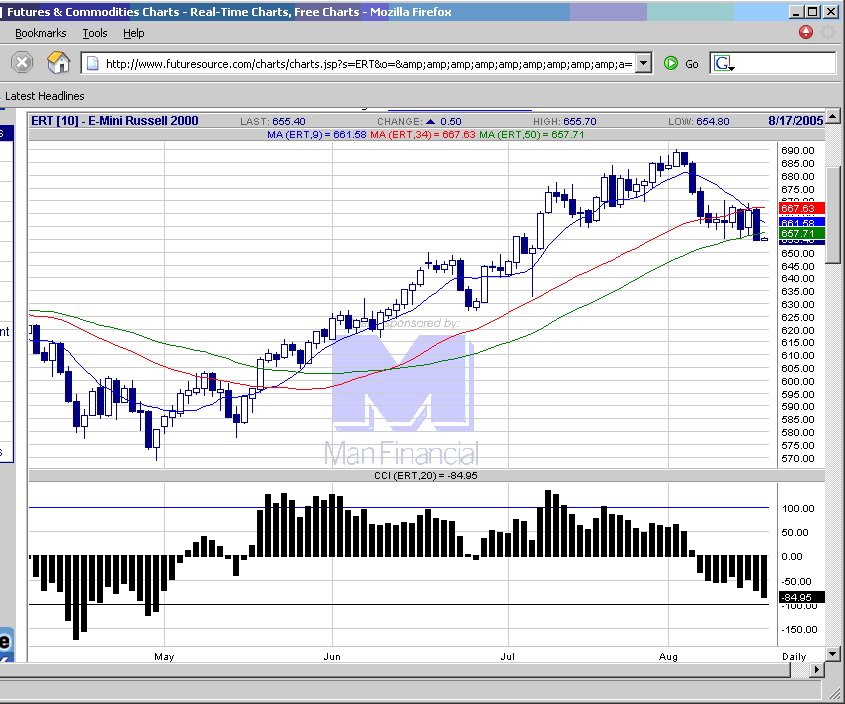
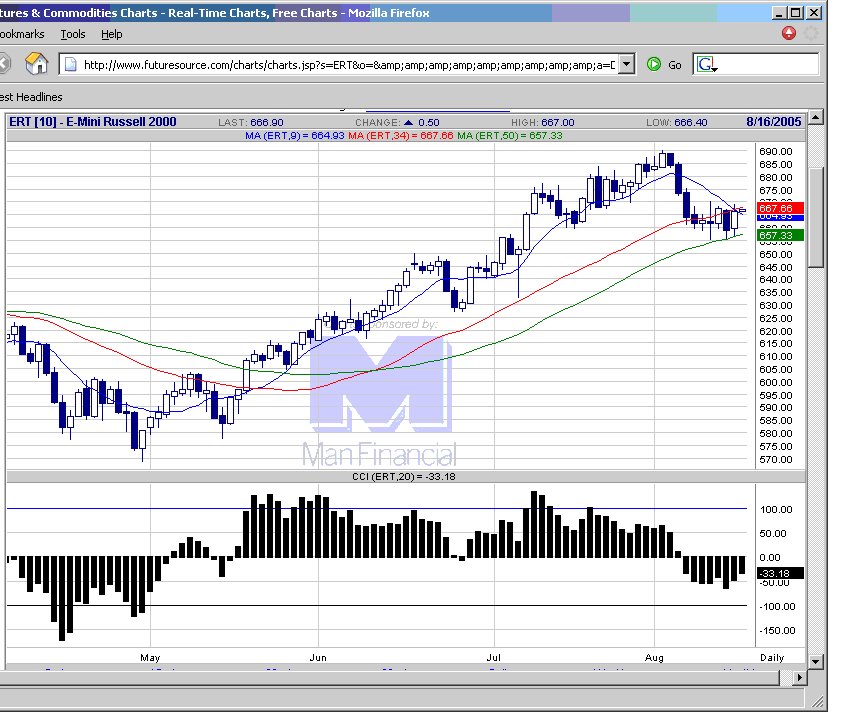
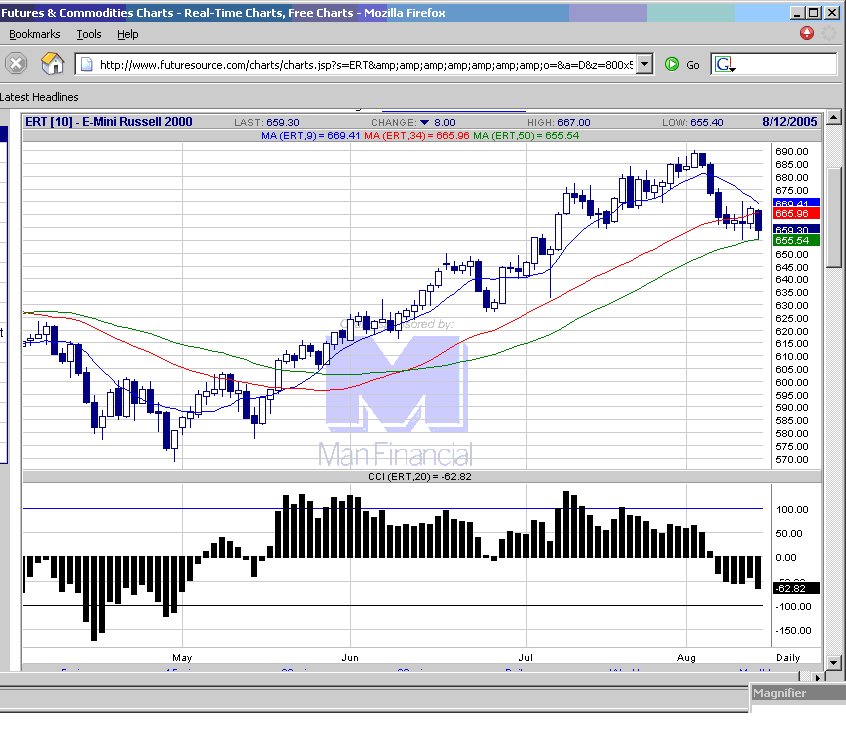
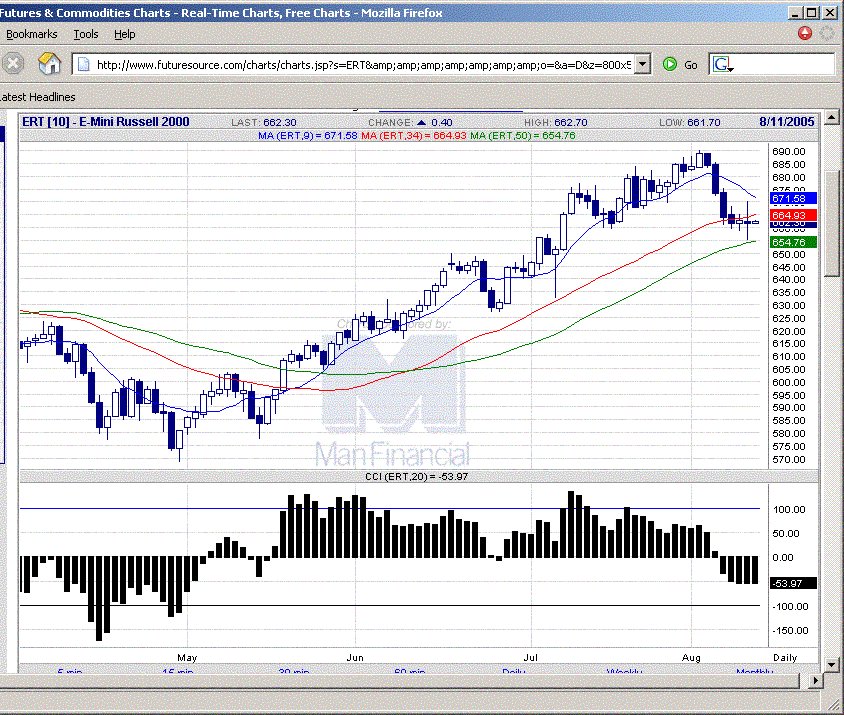
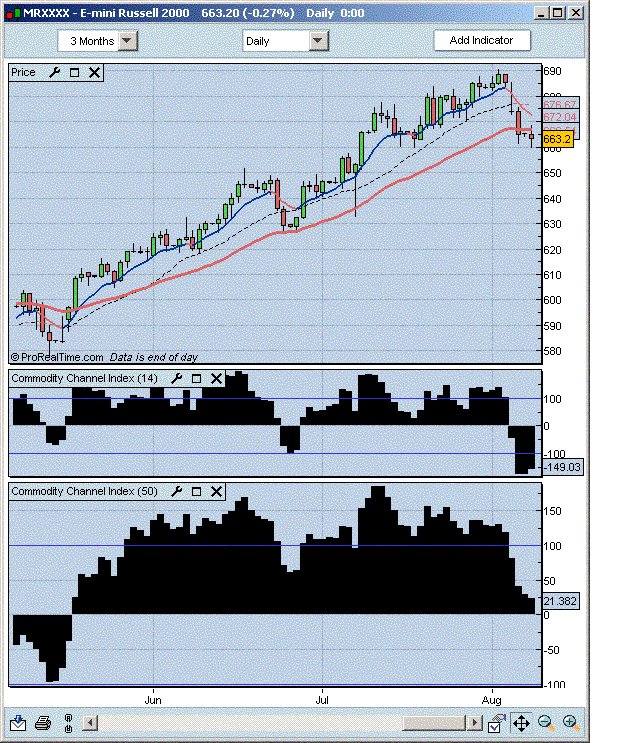
 E-mini Russell 2000 chart
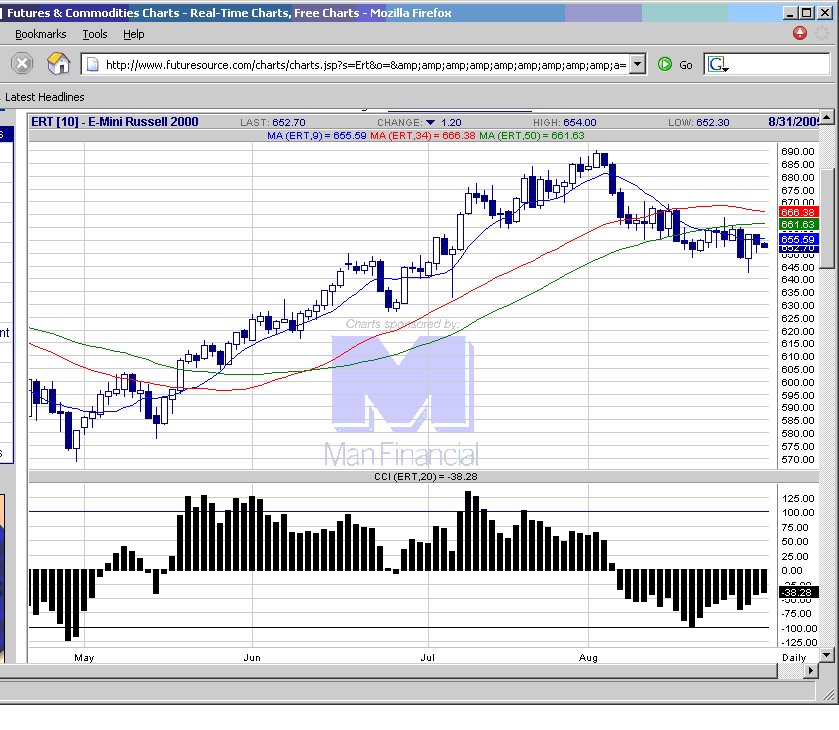
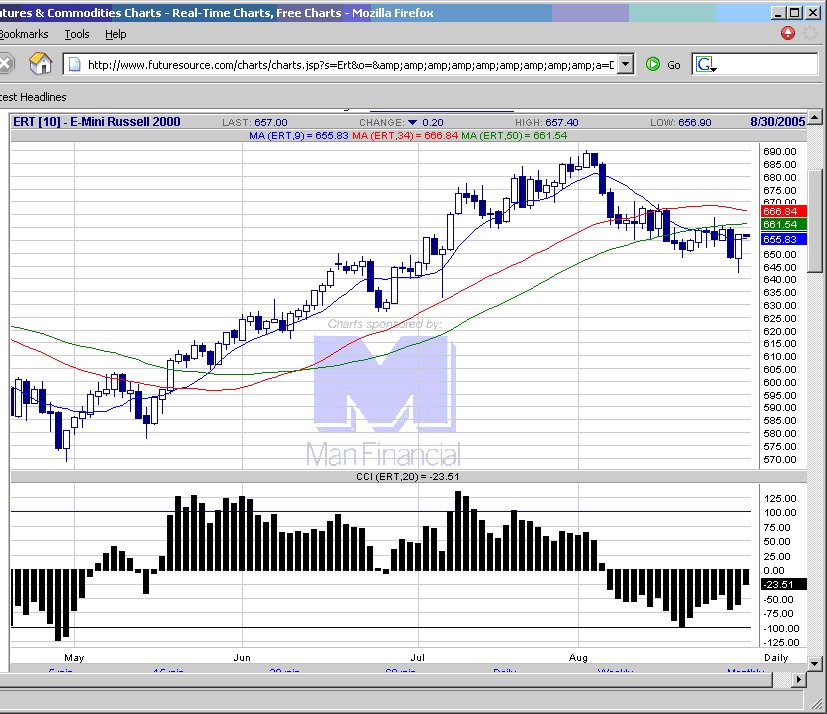
posted by emacro @ 4:53 PM
0 comments
![]()