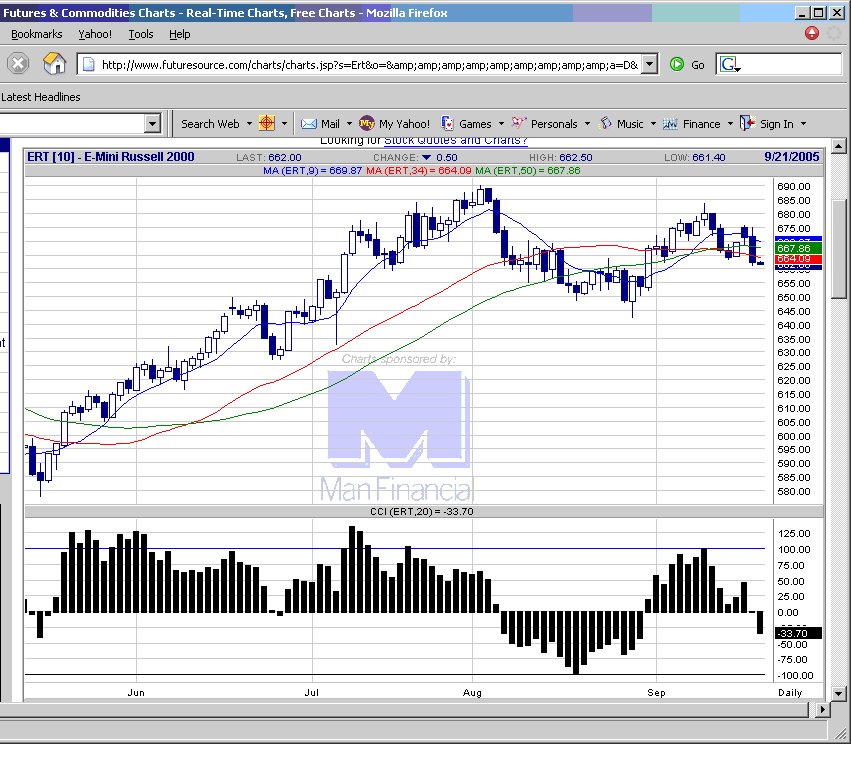
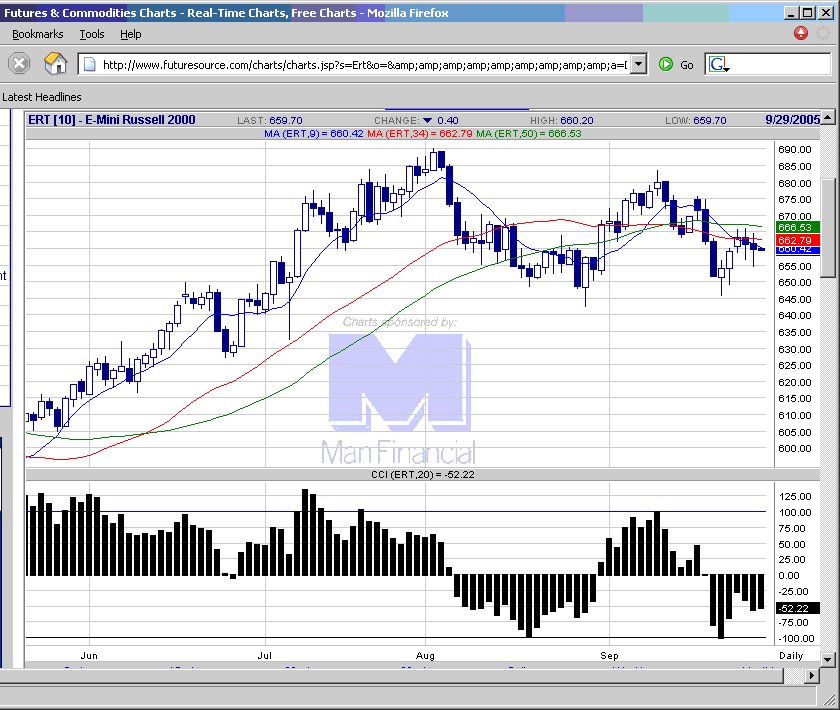
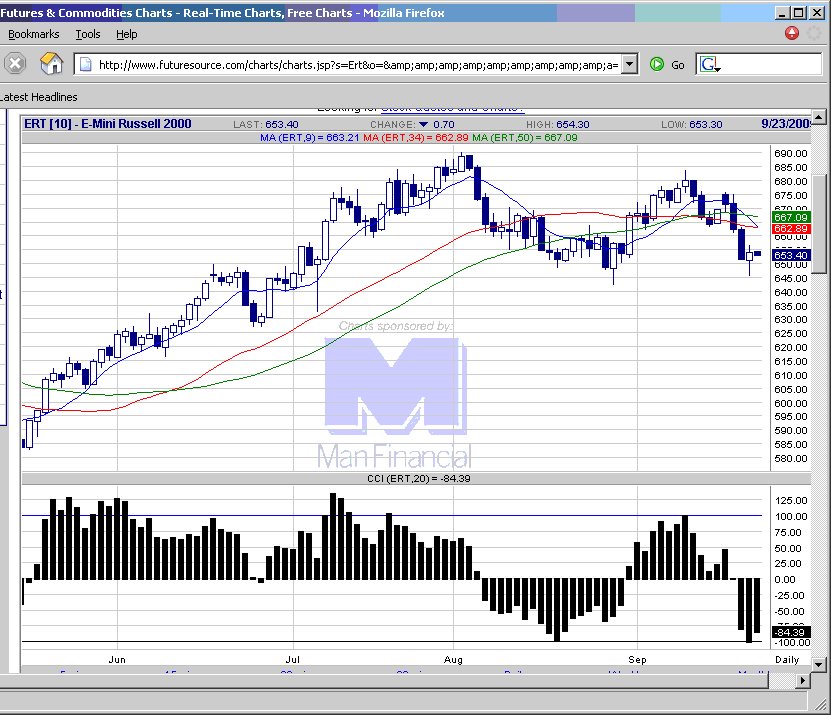
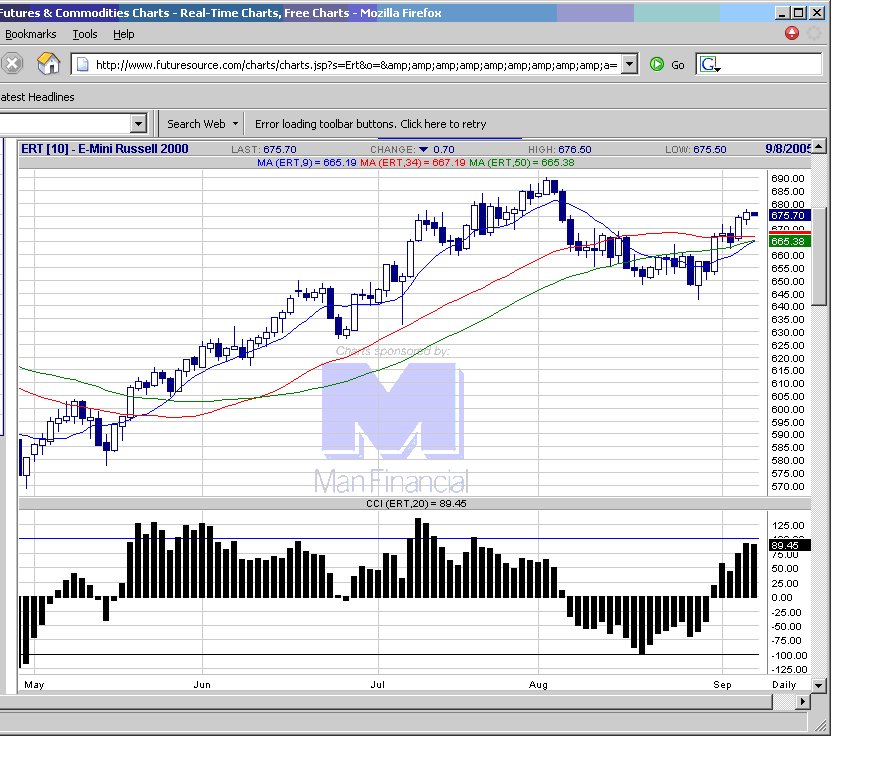
20050930 Breaking out of resistance of the triangle pattern. Could signal continuation of upside move next week.

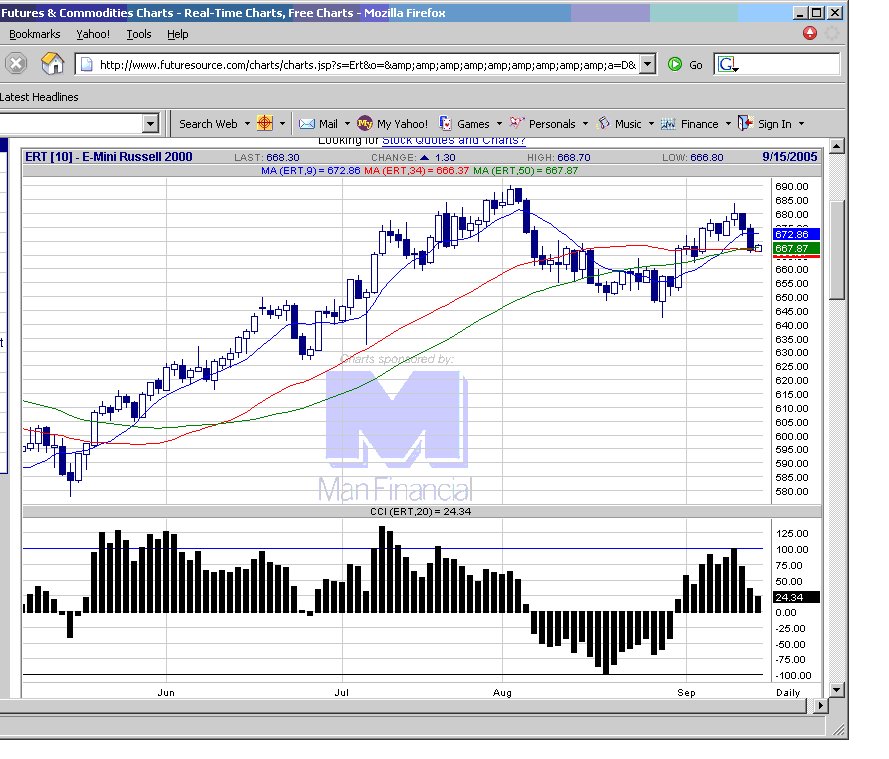
 E-mini Russell 2000 chart
posted by emacro @ 5:55 PM
0 comments
![]()
Since 2004, the e-mini Russell 2000 futures has emerged as one of the favourite trading vehicle. It has advantages of providing cover and exposure to the small cap sector of the US equity markets, in addition to good volatility and intraday and interday trending characteristics. This educatinal site will chronicle trading in the contract.
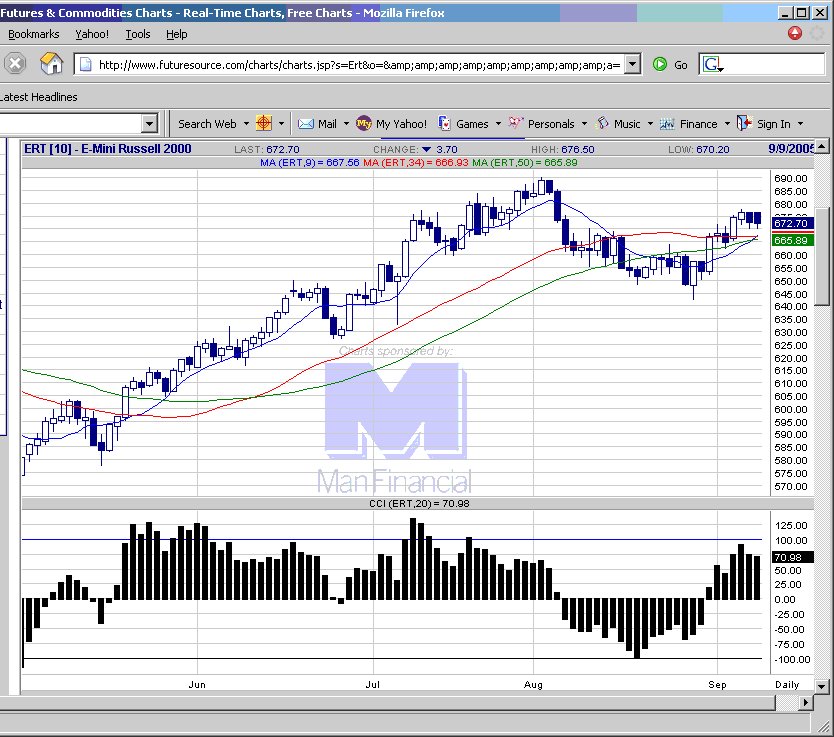
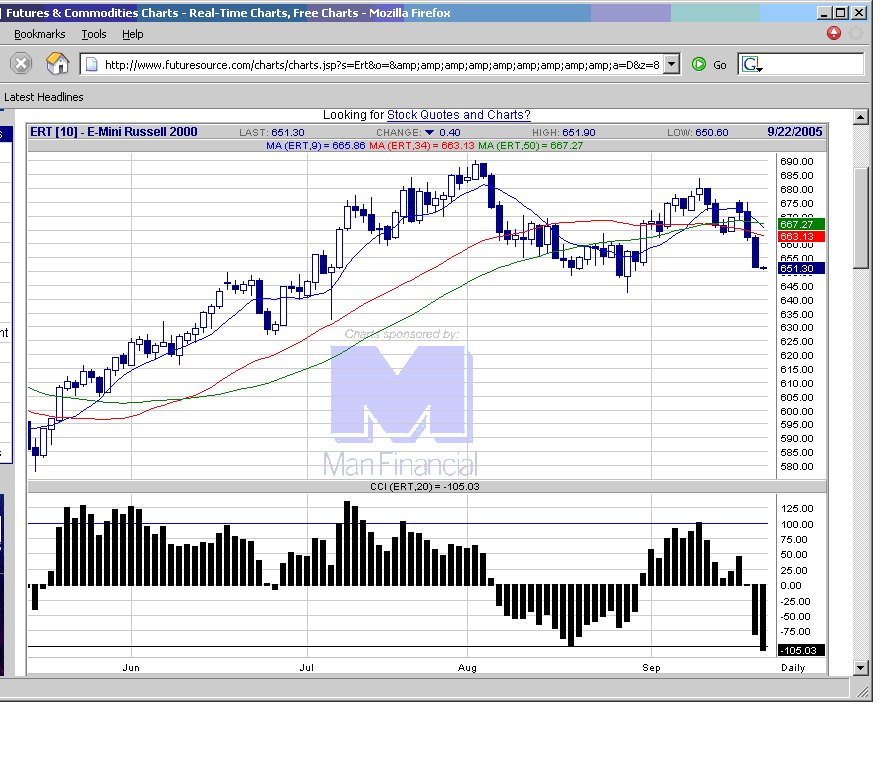
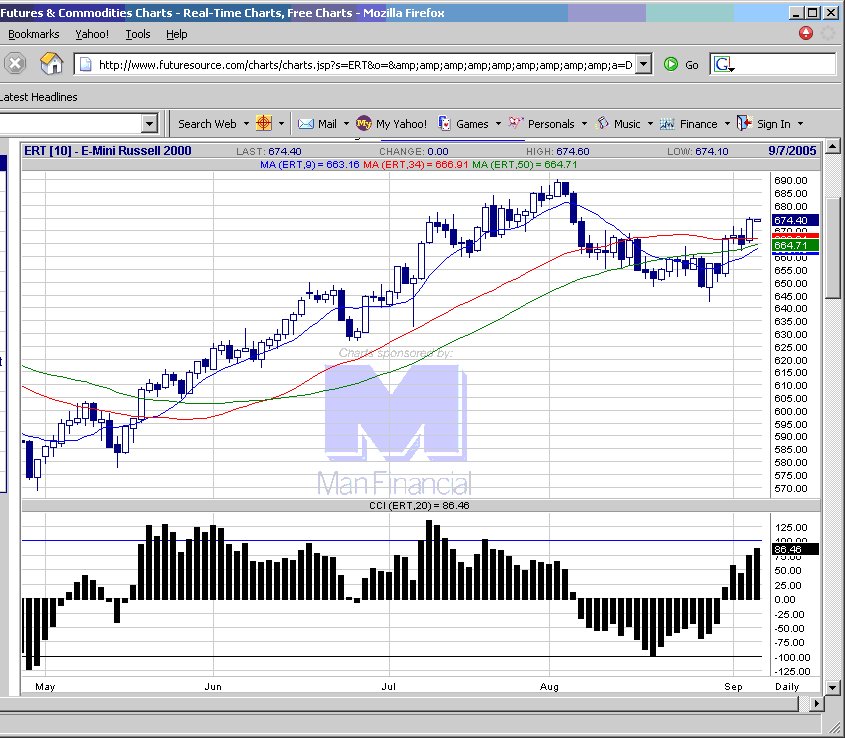
20050930 Breaking out of resistance of the triangle pattern. Could signal continuation of upside move next week.
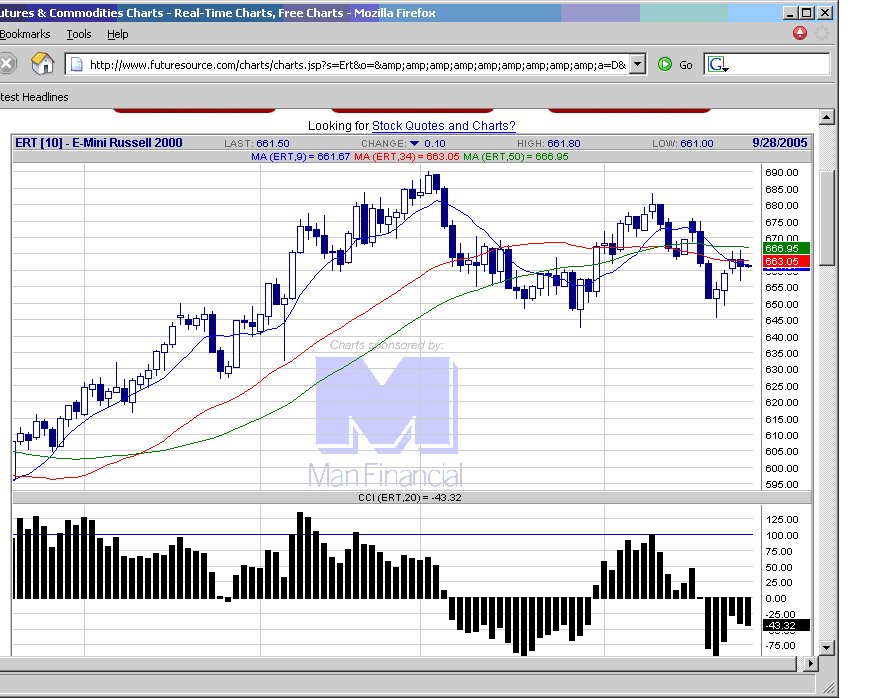
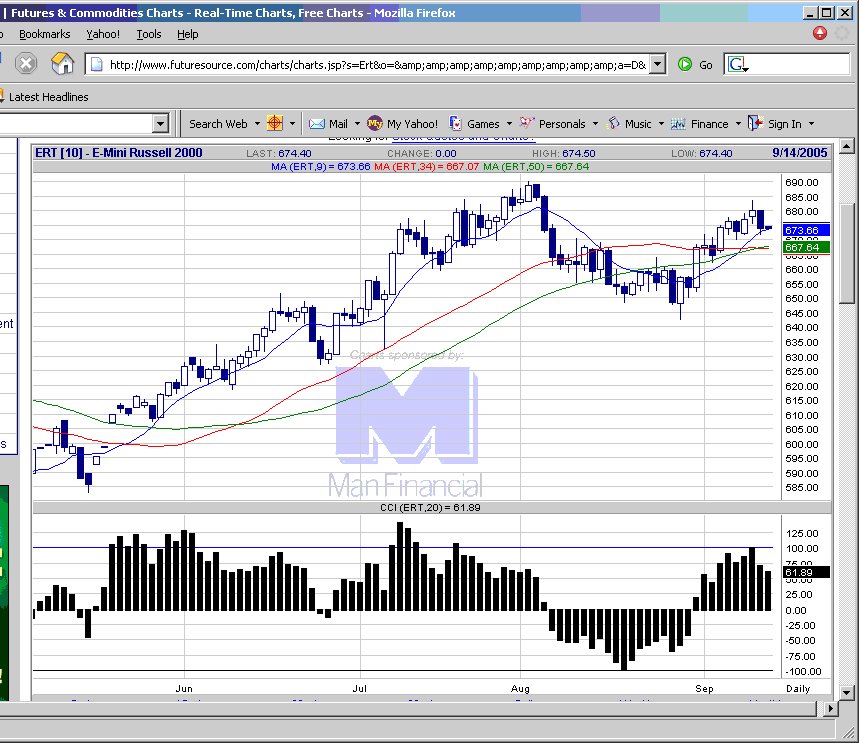
E-mini Russell 2000 chart
posted by emacro @ 5:55 PM
0 comments
![]()
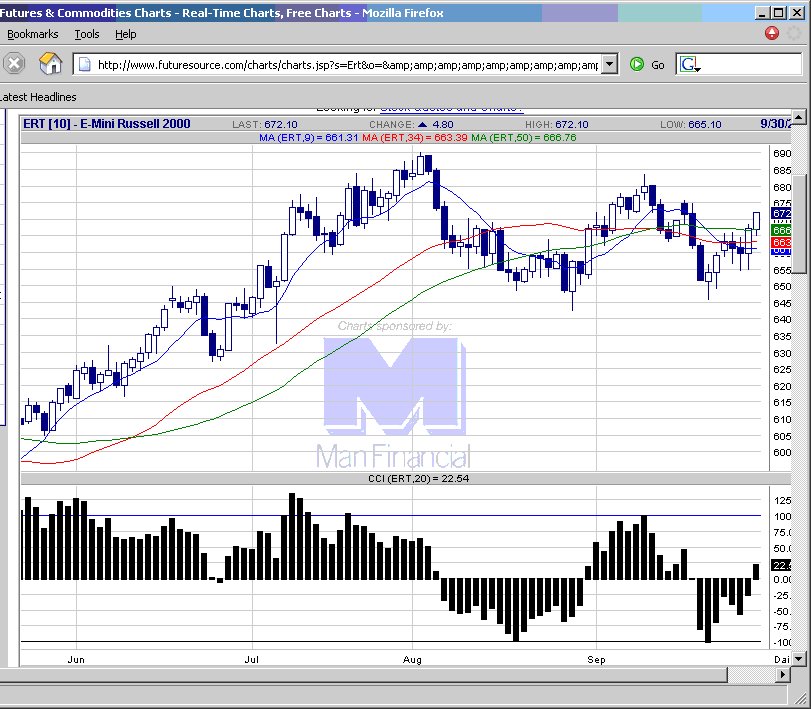
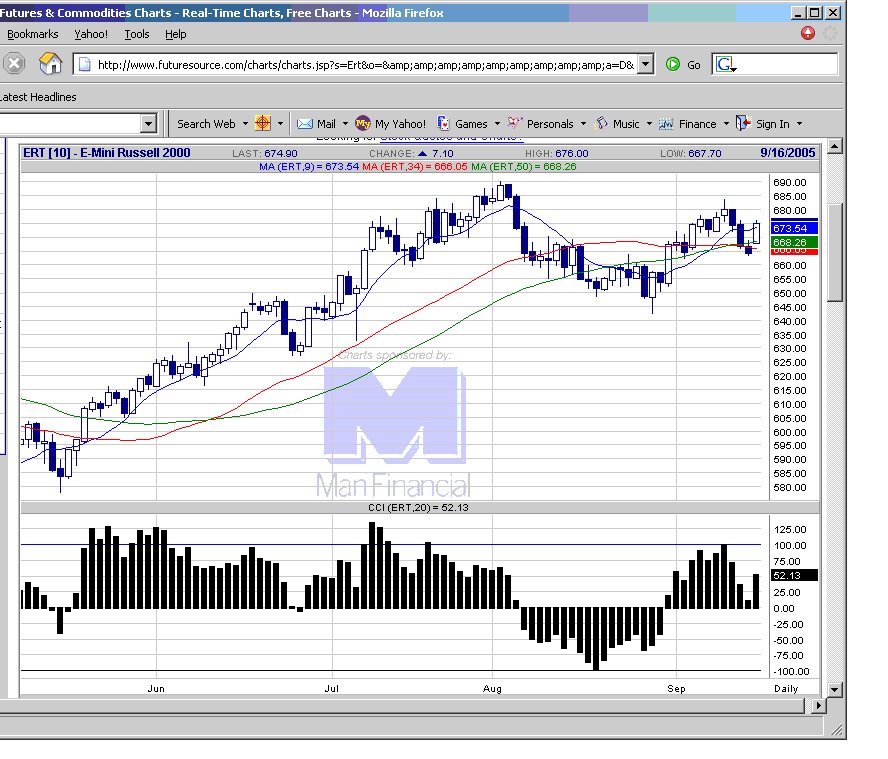
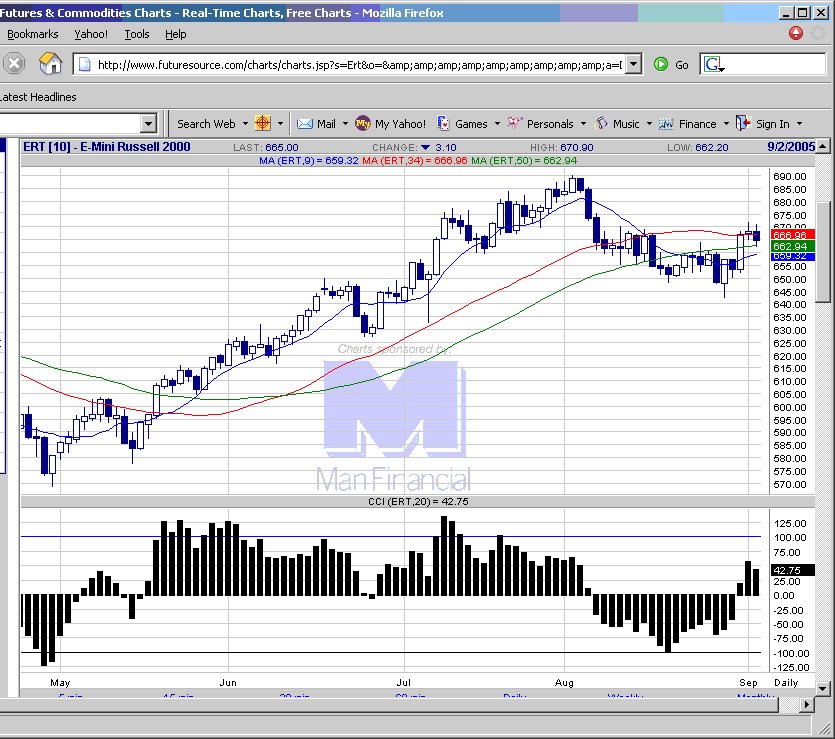
 E-mini Russell 2000 chart
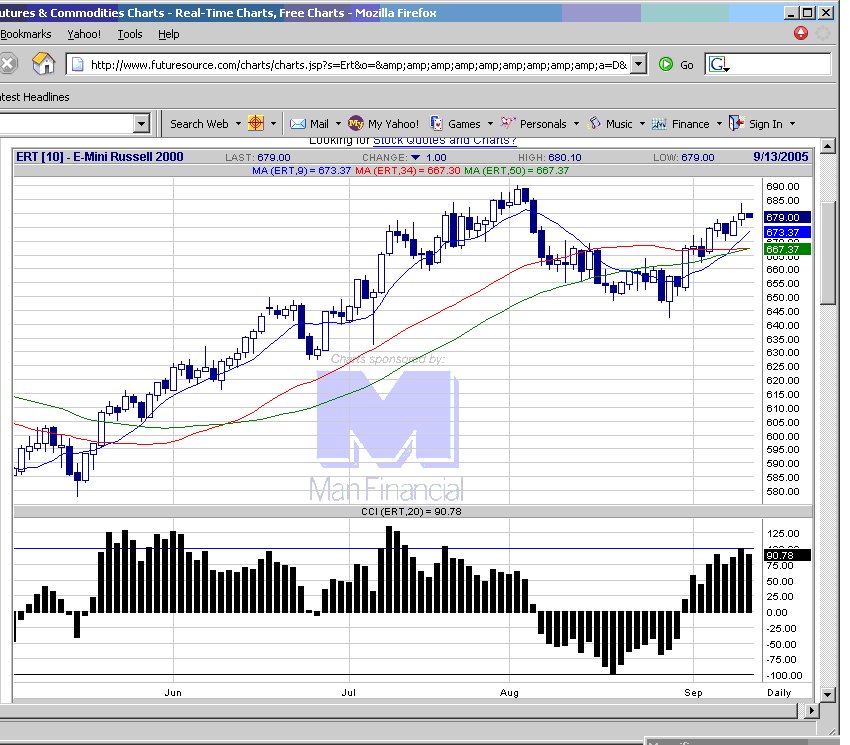
posted by emacro @ 6:29 PM
0 comments
![]()
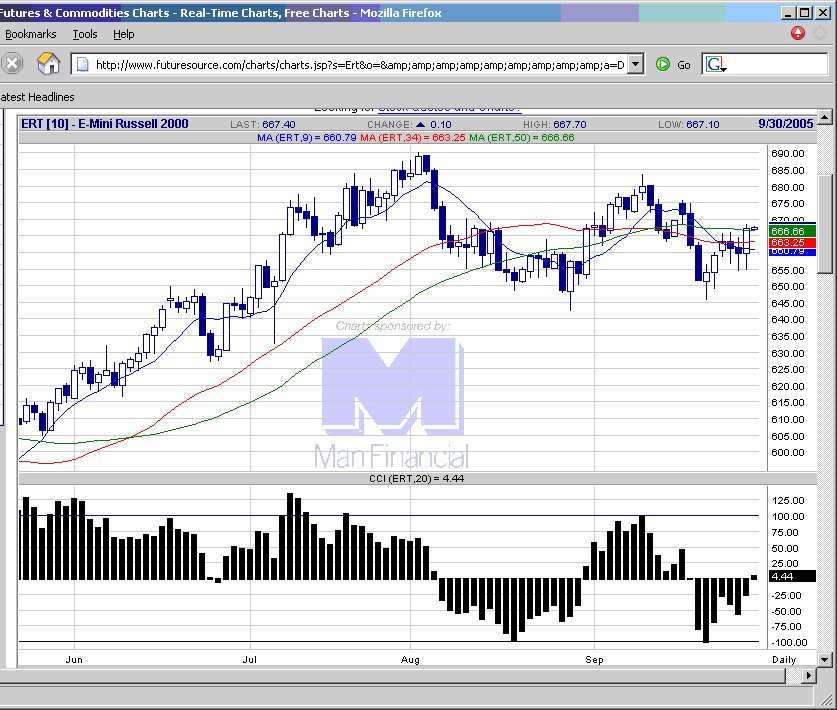
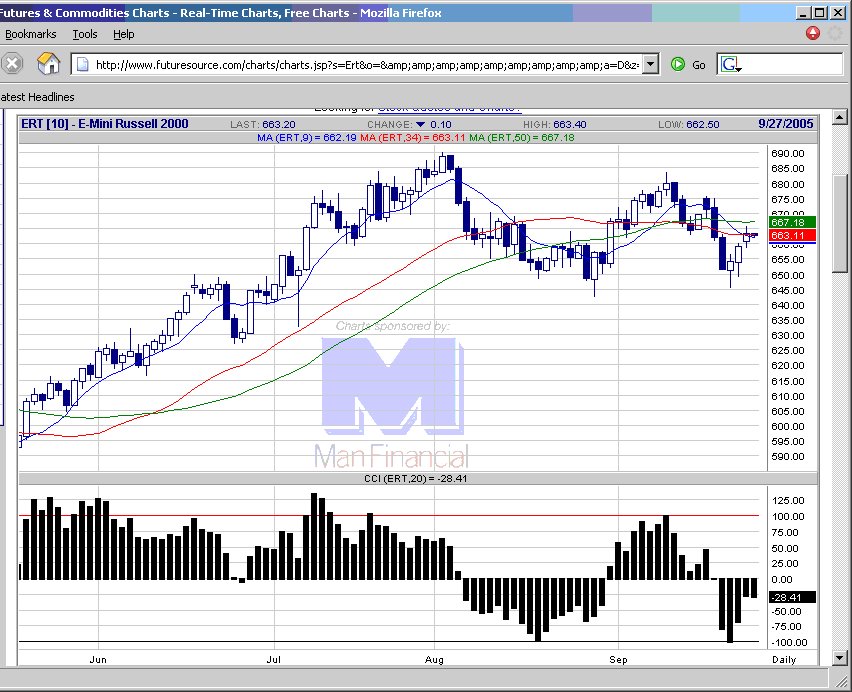
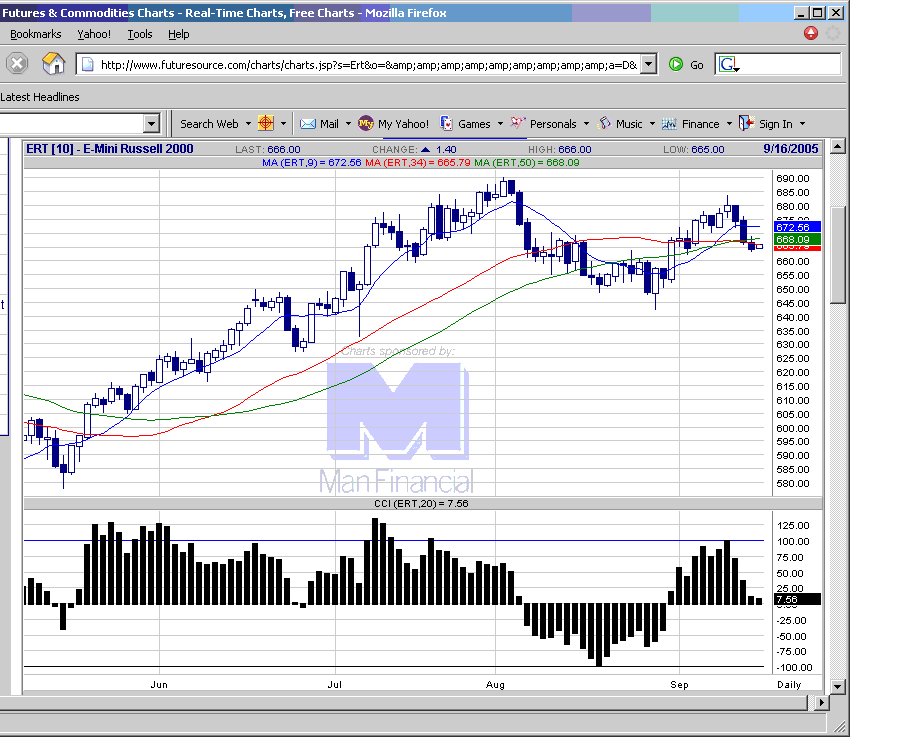
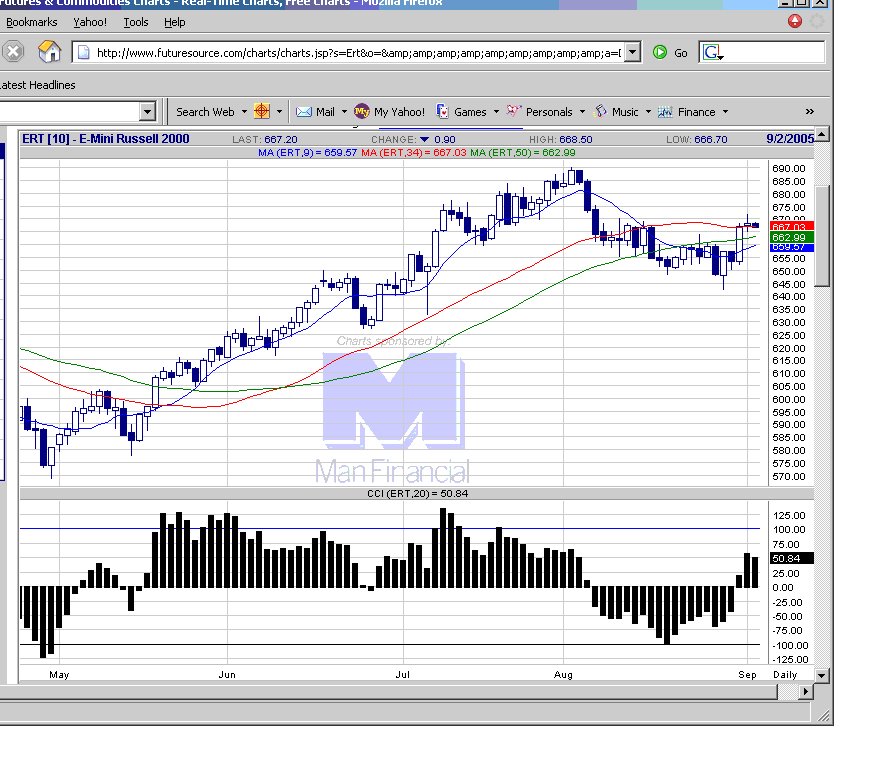
 E-mini Russell 2000 chart
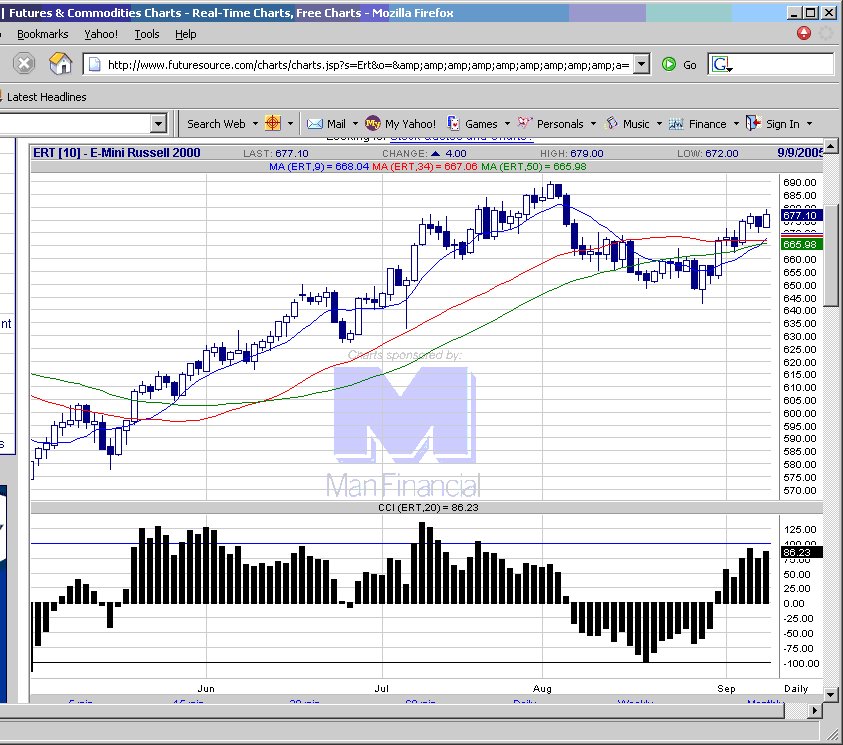
posted by emacro @ 7:45 PM
0 comments
![]()
 E-mini Russell 2000 chart
posted by emacro @ 7:00 PM
0 comments
![]()
 E-mini Russell 2000 chart
posted by emacro @ 5:08 PM
0 comments
![]()
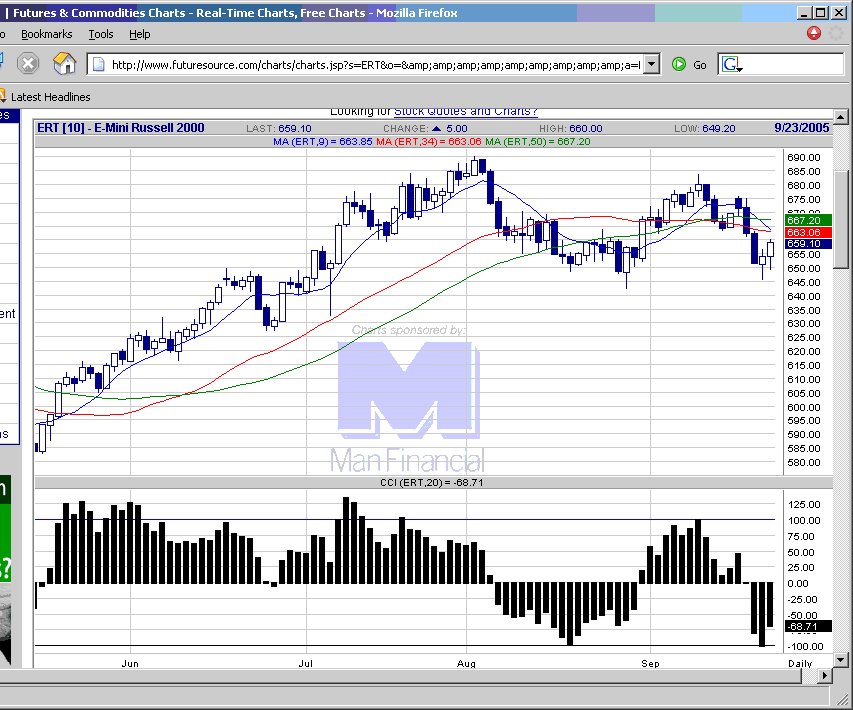 E-mini Russell 2000 chart
posted by emacro @ 12:40 AM
0 comments
![]()
 E-mini Russell 2000 chart
posted by emacro @ 6:35 PM
0 comments
![]()
 E-mini Russell 2000 chart
posted by emacro @ 6:02 PM
0 comments
![]()
 E-mini Russell 2000 chart
posted by emacro @ 6:11 PM
0 comments
![]()
 E-mini Russell 2000 chart
posted by emacro @ 4:57 PM
0 comments
![]()
 E-mini Russell 2000 chart
posted by emacro @ 5:30 PM
0 comments
![]()
 E-mini Russell 2000 chart
posted by emacro @ 7:07 PM
0 comments
![]()
 E-mini Russell 2000 chart
posted by emacro @ 4:53 PM
0 comments
![]()
 E-mini Russell 2000 chart
posted by emacro @ 6:28 PM
0 comments
![]()
 E-mini Russell 2000 chart
posted by emacro @ 4:58 PM
0 comments
![]()
 E-mini Russell 2000 chart
posted by emacro @ 5:14 PM
0 comments
![]()
 E-mini Russell 2000 chart
posted by emacro @ 7:35 PM
0 comments
![]()
 E-mini Russell 2000 chart
posted by emacro @ 6:29 PM
0 comments
![]()