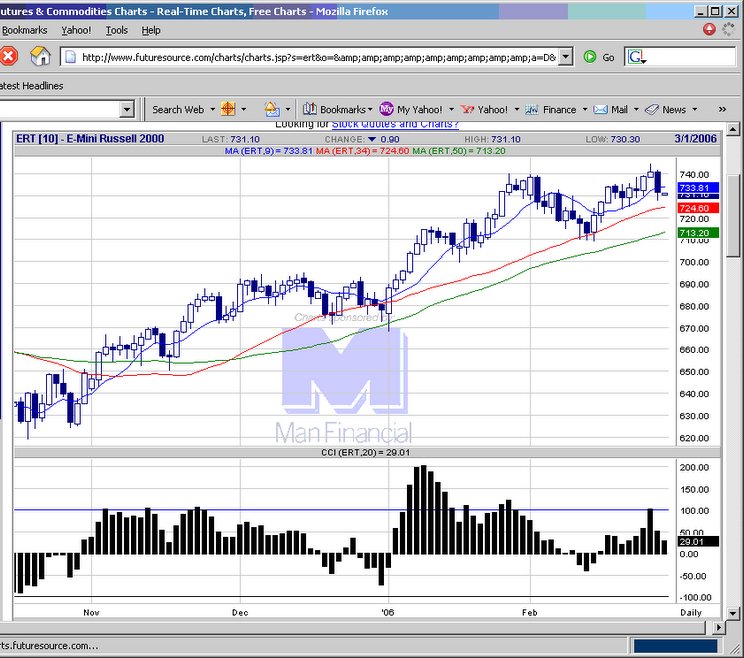
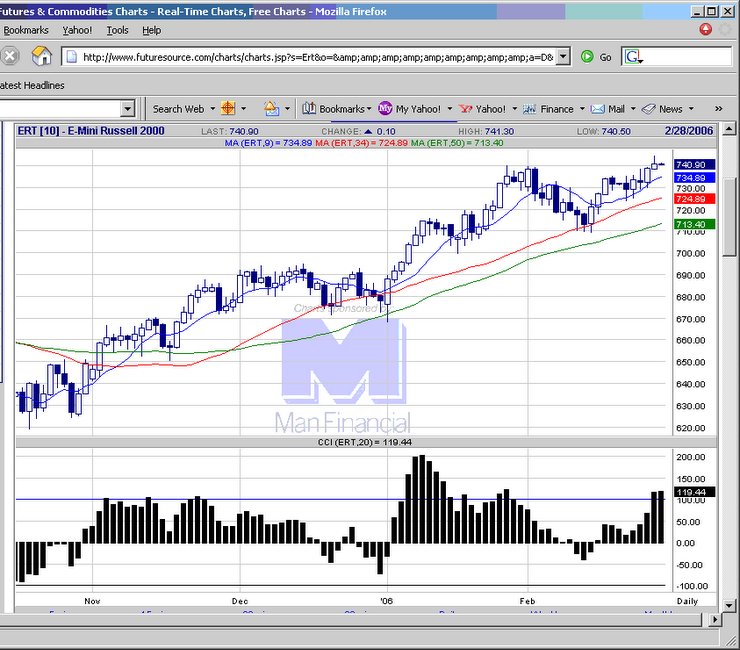
 20060228 Evening star reversal pattern & price closed below mov avg support, points to possibly more downside ahead.
  E-mini Russell 2000 chart
posted by emacro @ 4:43 PM
0 comments
![]()
Since 2004, the e-mini Russell 2000 futures has emerged as one of the favourite trading vehicle. It has advantages of providing cover and exposure to the small cap sector of the US equity markets, in addition to good volatility and intraday and interday trending characteristics. This educatinal site will chronicle trading in the contract.
20060228 Evening star reversal pattern & price closed below mov avg support, points to possibly more downside ahead.
E-mini Russell 2000 chart
posted by emacro @ 4:43 PM
0 comments
![]()
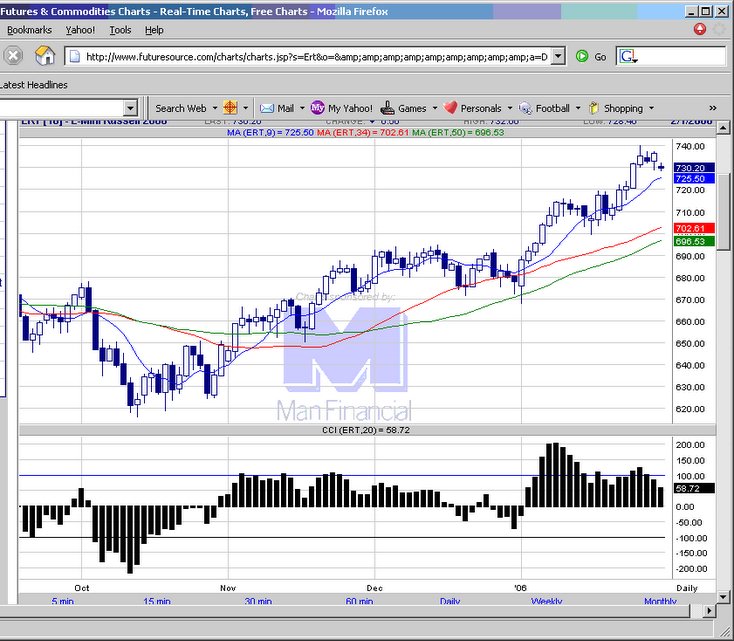
 20060227 Russel tried to break out today, but met some resistance. CCI momentum is strong, indicating sellers could be profit taking.
E-mini Russell 2000 chart
20060227 Russel tried to break out today, but met some resistance. CCI momentum is strong, indicating sellers could be profit taking.
E-mini Russell 2000 chart
posted by emacro @ 4:13 PM
0 comments
![]()
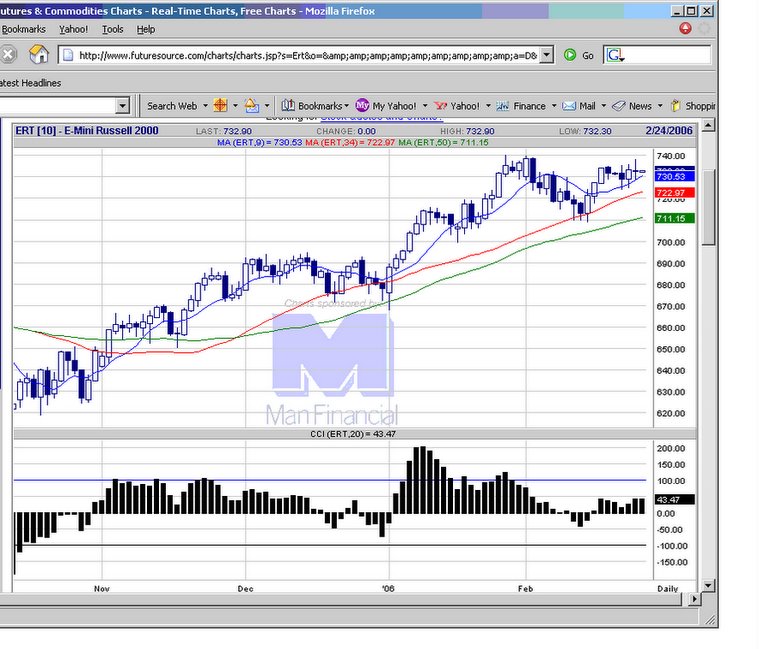
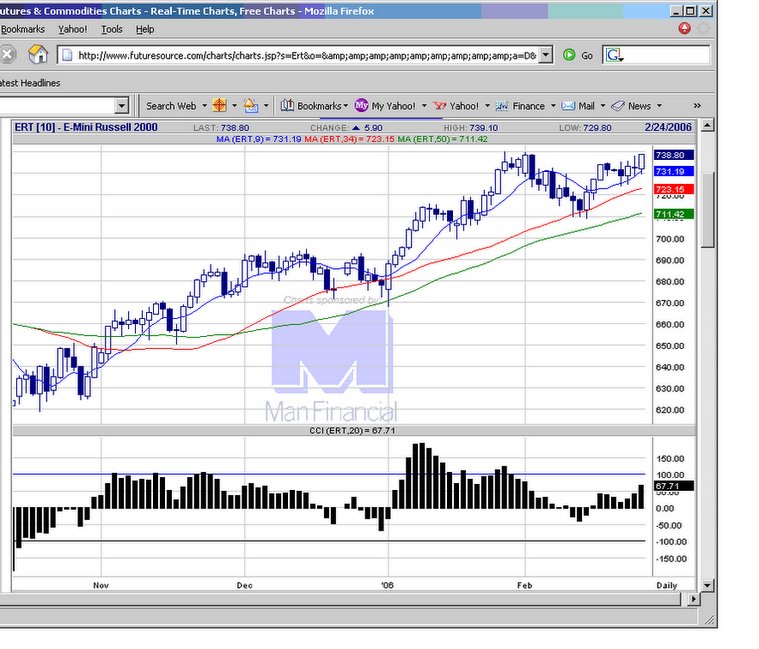 2060224 Candle shows strong buying interest, should be some strength at least in the morning on next Monday's opening.
E-mini Russell 2000 chart
2060224 Candle shows strong buying interest, should be some strength at least in the morning on next Monday's opening.
E-mini Russell 2000 chart
posted by emacro @ 6:34 PM
0 comments
![]()
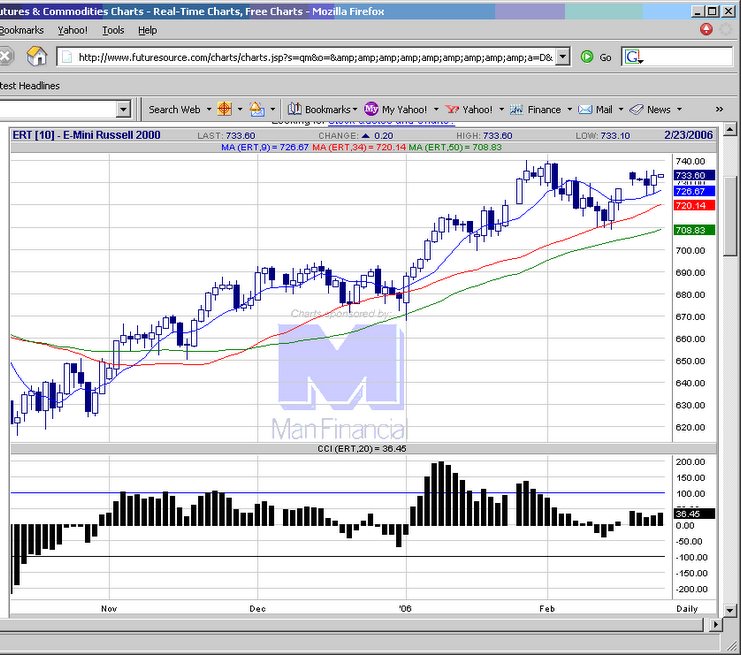
 20060223 A doji with long tails, indecision by the market. Think that we will see a large trend move today that may set the trend.
E-mini Russell 2000 chart
20060223 A doji with long tails, indecision by the market. Think that we will see a large trend move today that may set the trend.
E-mini Russell 2000 chart
posted by emacro @ 3:37 PM
0 comments
![]()
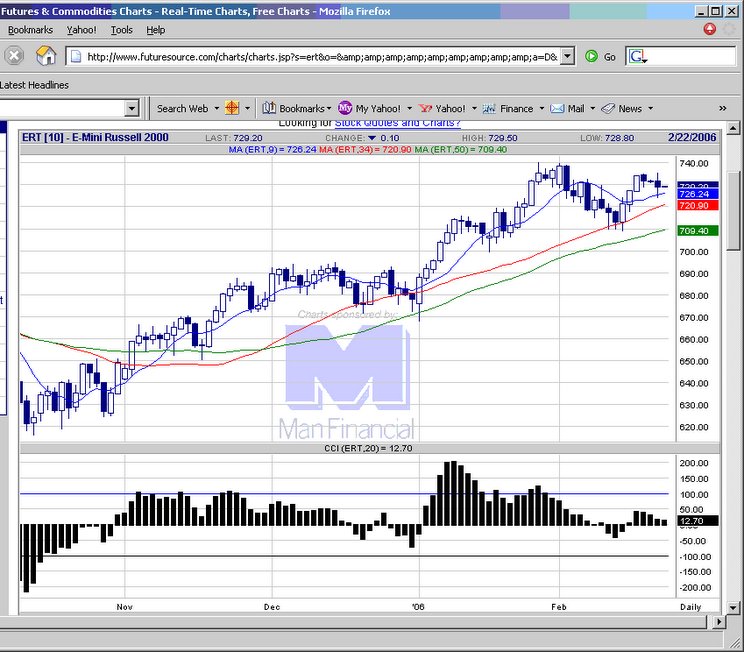
 20060222 A rebound, but is stil within the recent range, not something to get excited about.
E-mini Russell 2000 chart
20060222 A rebound, but is stil within the recent range, not something to get excited about.
E-mini Russell 2000 chart
posted by emacro @ 4:06 PM
0 comments
![]()
 20060221 A Spinning Top candle indicates indecisivenes, could be some range trading ahead.
E-mini Russell 2000 chart
20060221 A Spinning Top candle indicates indecisivenes, could be some range trading ahead.
E-mini Russell 2000 chart
posted by emacro @ 4:07 PM
0 comments
![]()
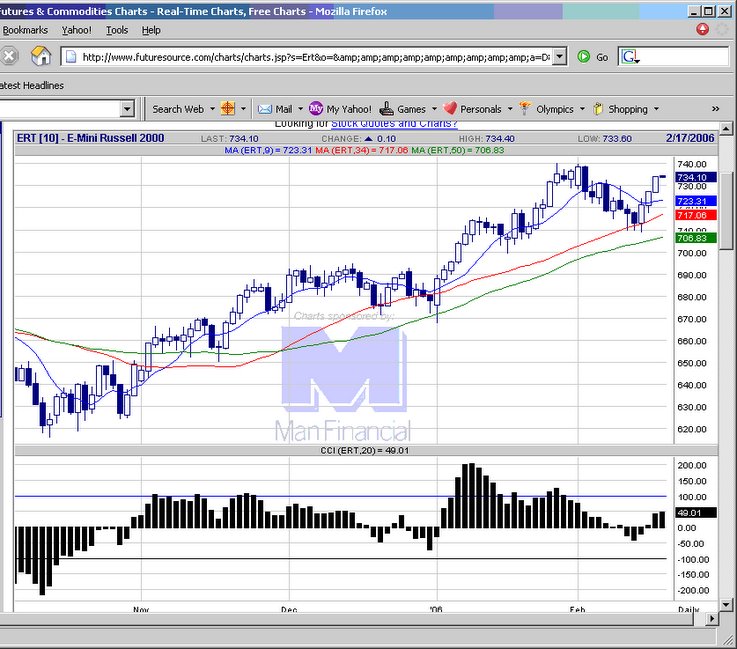
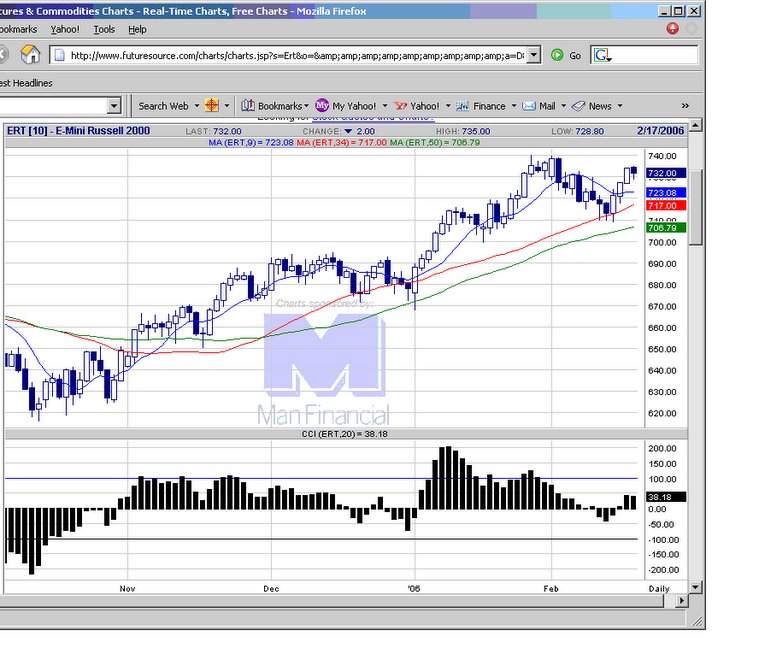 20060217 Russell failed to maintain the torrid pace of the last few days of rally. Consolidation trade view still intact, unless new highs are made.
E-mini Russell 2000 chart
20060217 Russell failed to maintain the torrid pace of the last few days of rally. Consolidation trade view still intact, unless new highs are made.
E-mini Russell 2000 chart
posted by emacro @ 5:20 PM
0 comments
![]()
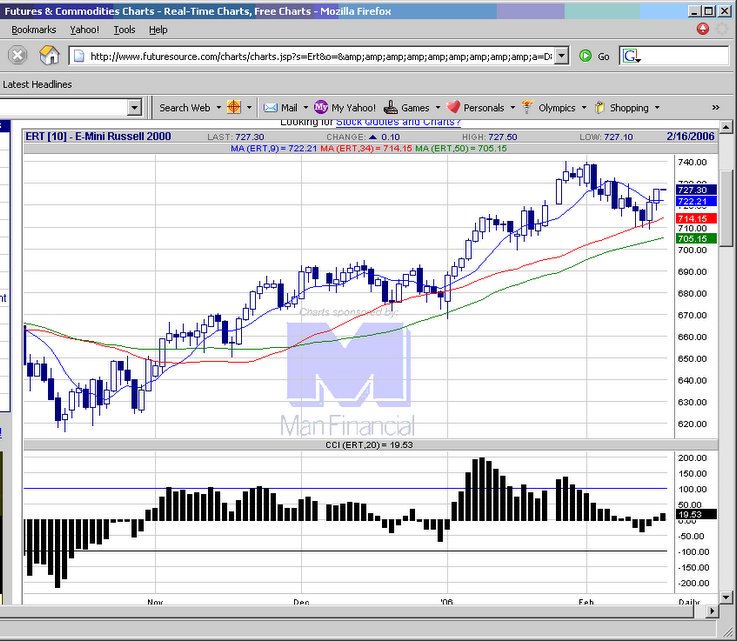
 20060216 Continues on this current pmove, with CCI building momentum. Test of previous high on the cards.
E-mini Russell 2000 chart
20060216 Continues on this current pmove, with CCI building momentum. Test of previous high on the cards.
E-mini Russell 2000 chart
posted by emacro @ 4:03 PM
0 comments
![]()
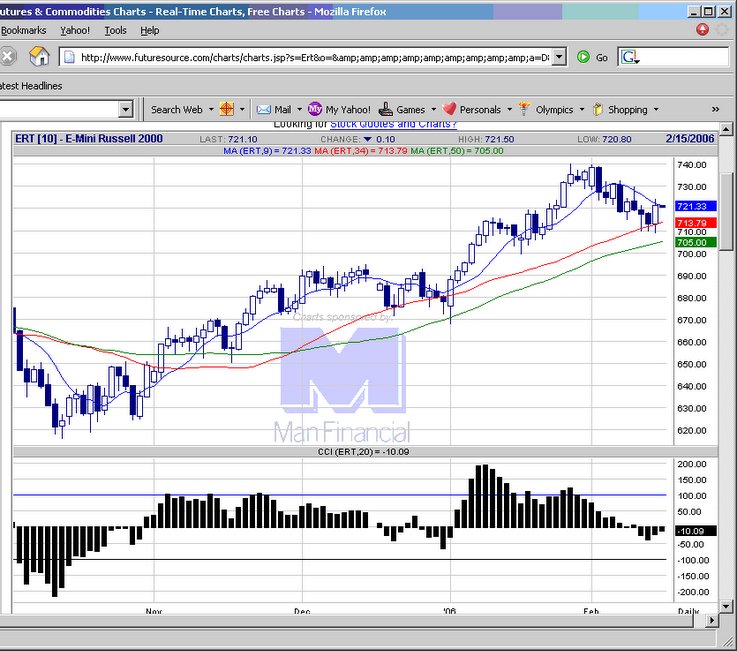
 20060215 Looks like could be forming a trading range in the sessions ahed.
E-mini Russell 2000 chart
20060215 Looks like could be forming a trading range in the sessions ahed.
E-mini Russell 2000 chart
posted by emacro @ 4:13 PM
0 comments
![]()
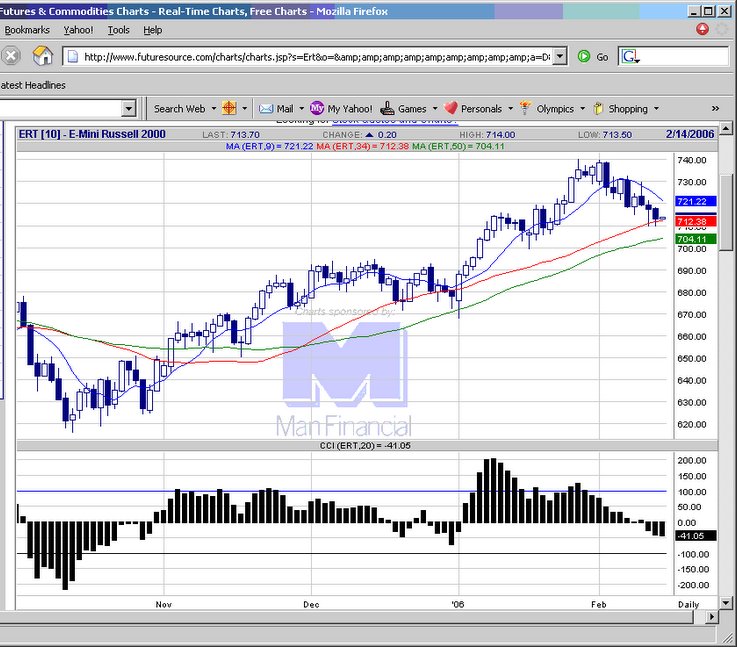
 20060214 Rallies to the moving avg resistance, needs CCI to punch through zero line to break any resistances.
E-mini Russell 2000 chart
20060214 Rallies to the moving avg resistance, needs CCI to punch through zero line to break any resistances.
E-mini Russell 2000 chart
posted by emacro @ 4:17 PM
0 comments
![]()
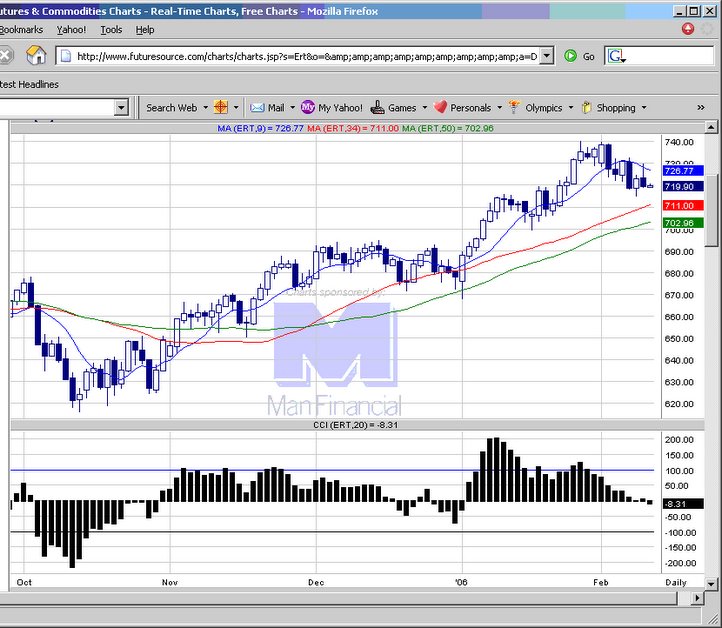
 20060213 Downward move continues. Russell small caps, which has been leading the market higher with resilience, losing the lustre somewhat.
E-mini Russell 2000 chart
20060213 Downward move continues. Russell small caps, which has been leading the market higher with resilience, losing the lustre somewhat.
E-mini Russell 2000 chart
posted by emacro @ 4:43 PM
0 comments
![]()
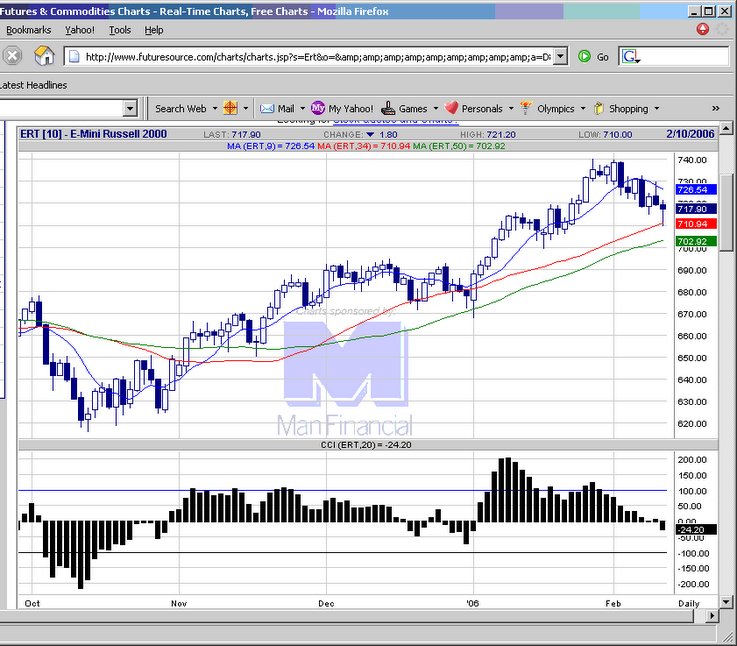 20060210 Bounced off nicely from the mov avg support 710 area. Candlestick indicates a hammer, which is a bullish reversal pattern. Russell reversal could save the S&P 500 from the H&S pattern.
E-mini Russell 2000 chart
20060210 Bounced off nicely from the mov avg support 710 area. Candlestick indicates a hammer, which is a bullish reversal pattern. Russell reversal could save the S&P 500 from the H&S pattern.
E-mini Russell 2000 chart
posted by emacro @ 5:14 PM
0 comments
![]()
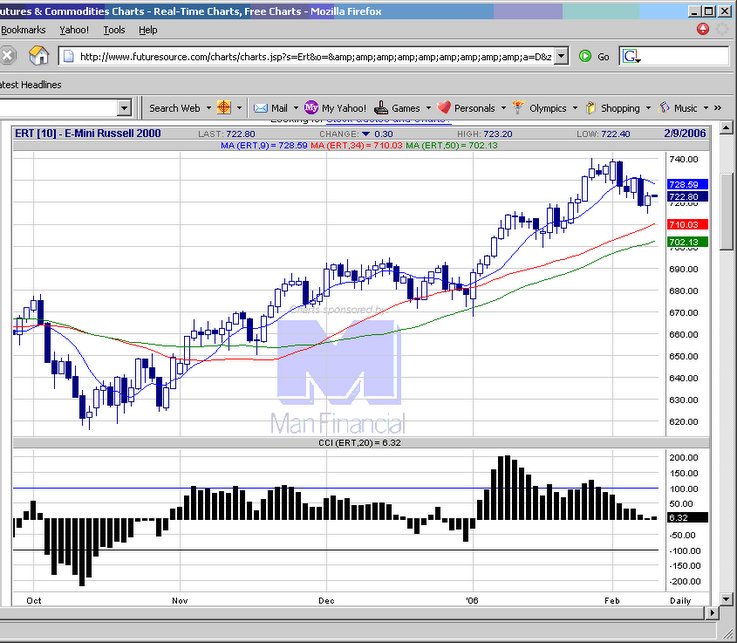
 20060209 Russell finally breaks support at CCI=0. Could not sustain early morning rally, showing some signs of cracking.
E-mini Russell 2000 chart
20060209 Russell finally breaks support at CCI=0. Could not sustain early morning rally, showing some signs of cracking.
E-mini Russell 2000 chart
posted by emacro @ 4:16 PM
0 comments
![]()
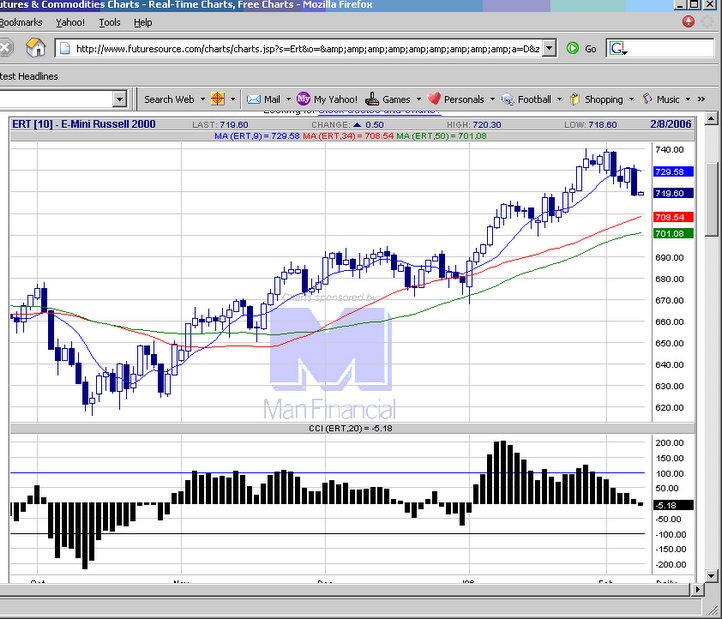
 20060208 Russel has been the market leader. The rebound today was not as strong as the major indices, so it points out that the rally today could be short lived.
E-mini Russell 2000 chart
20060208 Russel has been the market leader. The rebound today was not as strong as the major indices, so it points out that the rally today could be short lived.
E-mini Russell 2000 chart
posted by emacro @ 4:00 PM
0 comments
![]()
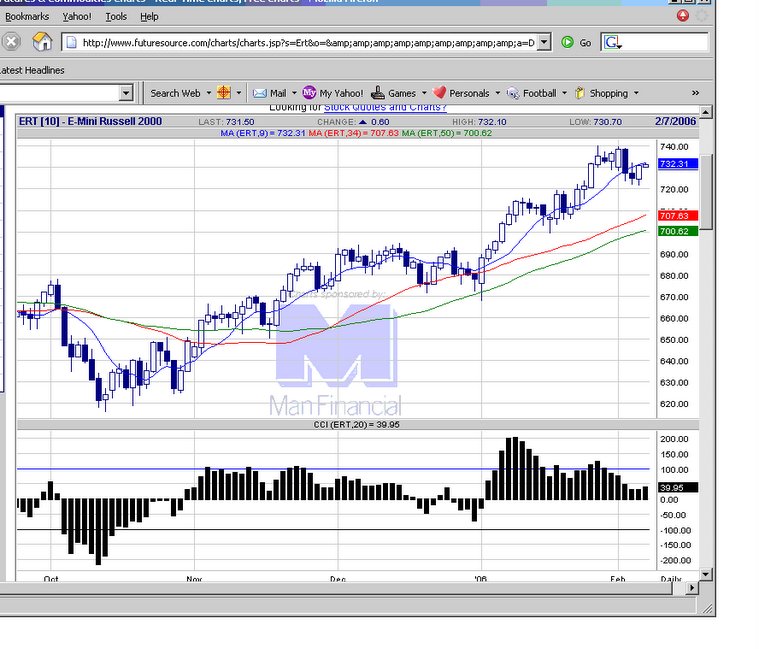
 20060207 An engulfing bearish candlestick pattern, with the CCI breaking below the zero line, bearish signs begins to pile up.
E-mini Russell 2000 chart
20060207 An engulfing bearish candlestick pattern, with the CCI breaking below the zero line, bearish signs begins to pile up.
E-mini Russell 2000 chart
posted by emacro @ 3:34 PM
0 comments
![]()
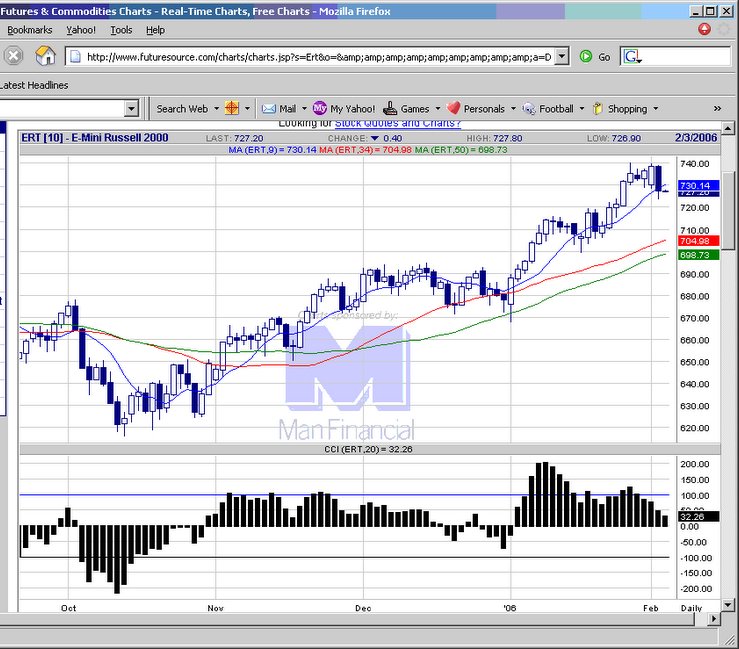
 20060206 Small cap Russell seems resilient to selldown, lending support to slow the downdraft in the other 3 major indices.
E-mini Russell 2000 chart
20060206 Small cap Russell seems resilient to selldown, lending support to slow the downdraft in the other 3 major indices.
E-mini Russell 2000 chart
posted by emacro @ 3:40 PM
0 comments
![]()
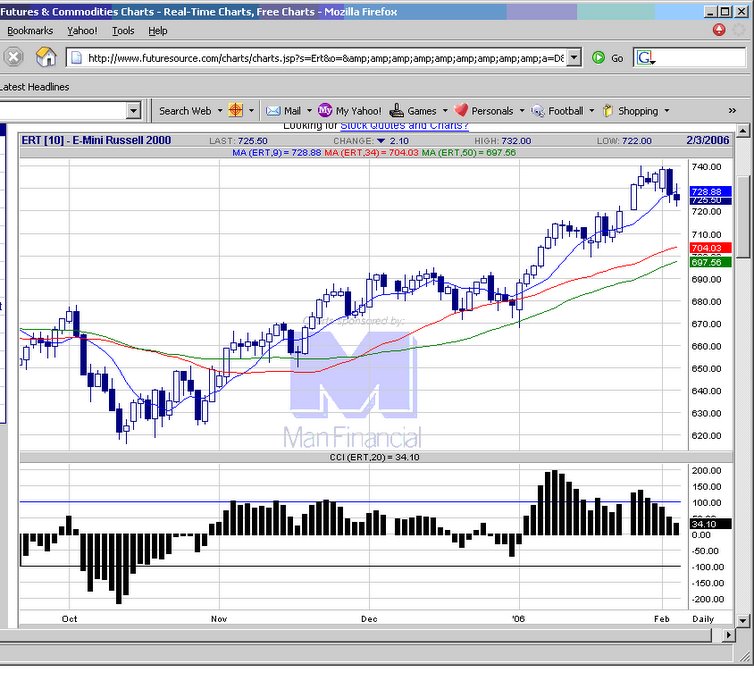 20060203 Further weakness, but unline the major indices of big caps, in a better technical position.
E-mini Russell 2000 chart
20060203 Further weakness, but unline the major indices of big caps, in a better technical position.
E-mini Russell 2000 chart
posted by emacro @ 6:17 PM
0 comments
![]()
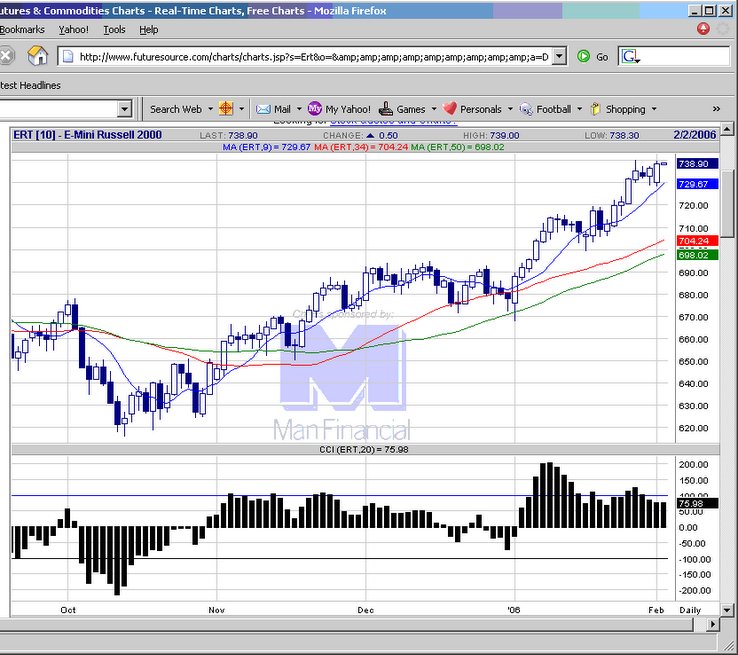
 20060202 With the engulfing bearish candlestick pattern and the close below the mov avg support, Russell futures show the first signs of cracking. Should a period of down and consolidation ahead.
E-mini Russell 2000 chart
20060202 With the engulfing bearish candlestick pattern and the close below the mov avg support, Russell futures show the first signs of cracking. Should a period of down and consolidation ahead.
E-mini Russell 2000 chart
posted by emacro @ 4:41 PM
0 comments
![]()
 20060102 Tried to test the all time high again. CCI momentum is still strong, with no signs of cracking in the uptrend.
E-mini Russell 2000 chart
20060102 Tried to test the all time high again. CCI momentum is still strong, with no signs of cracking in the uptrend.
E-mini Russell 2000 chart
posted by emacro @ 4:54 PM
0 comments
![]()