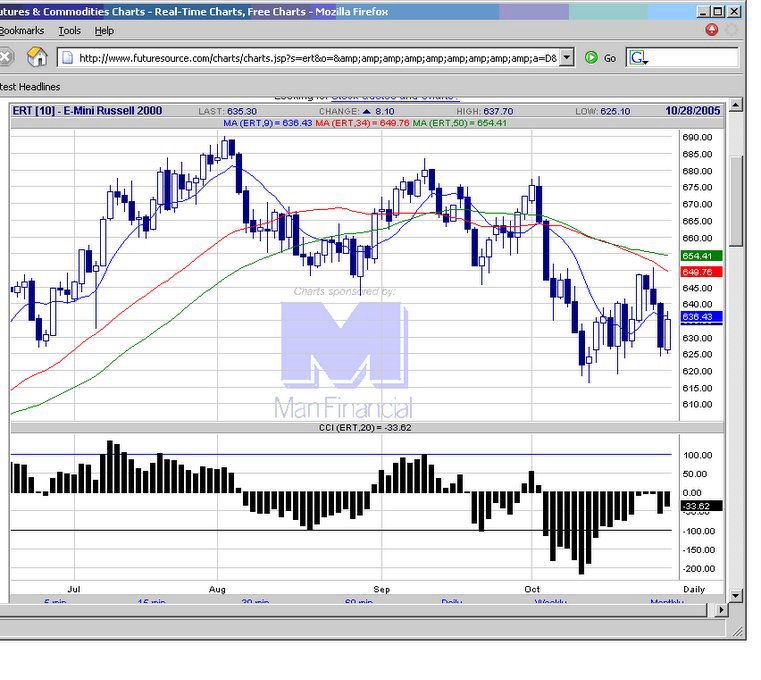
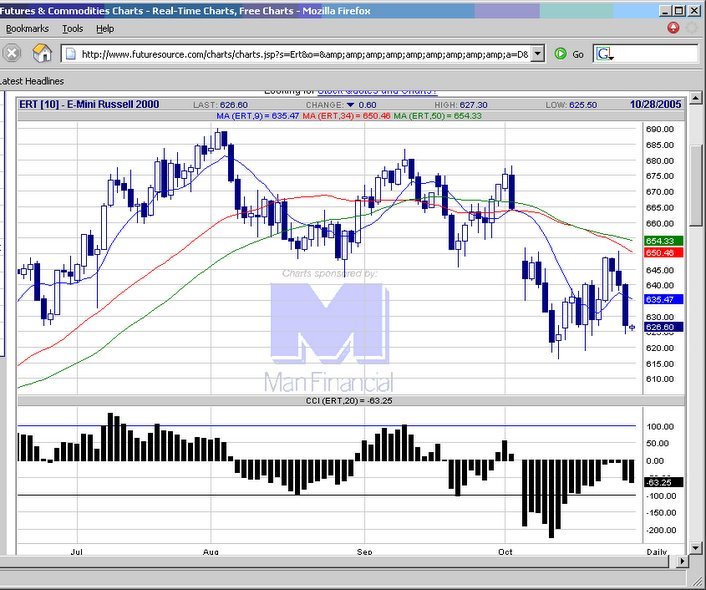
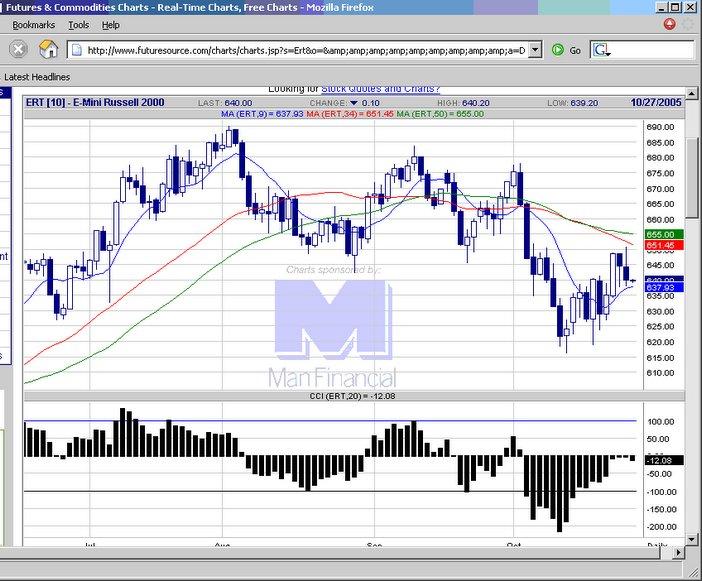
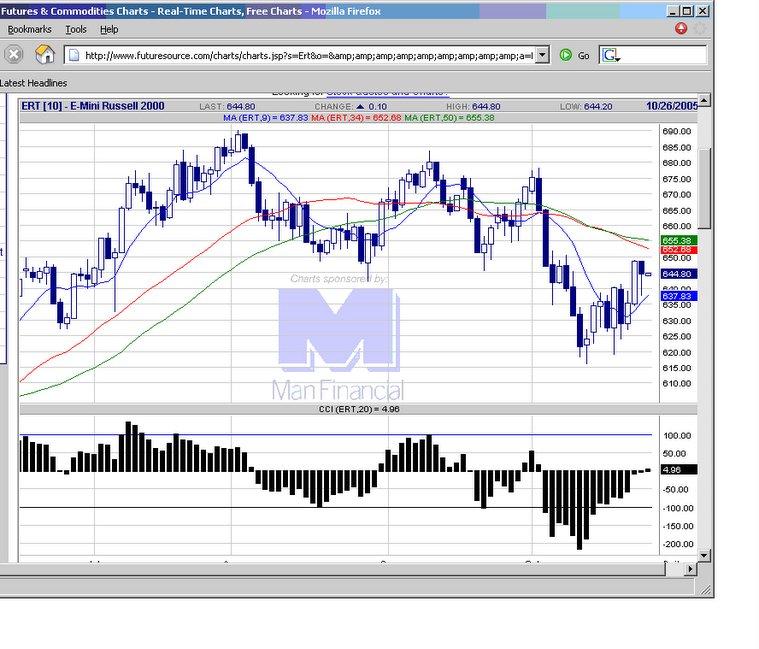
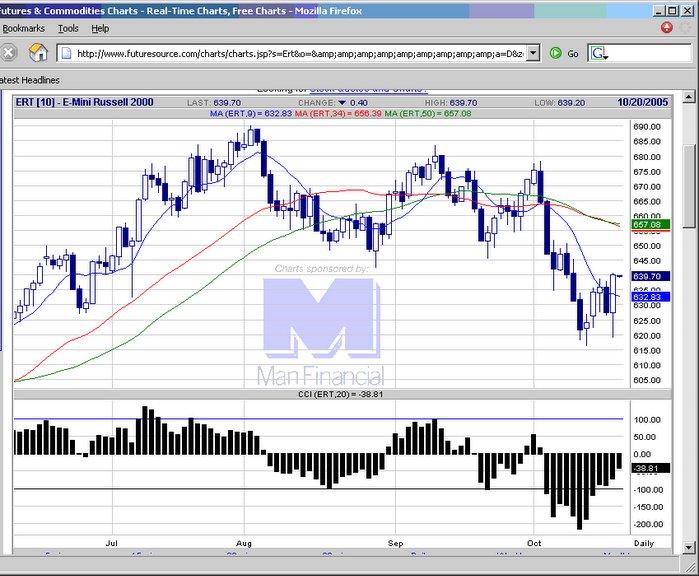
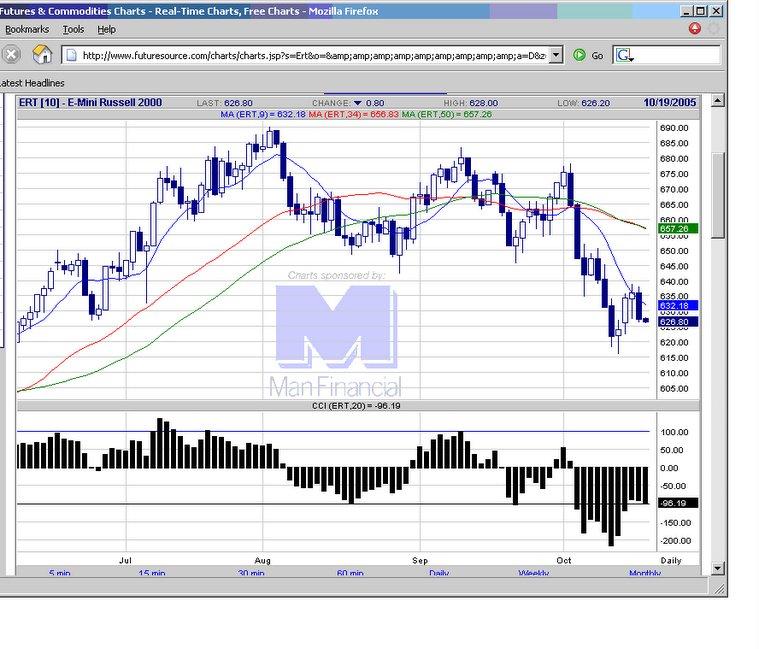
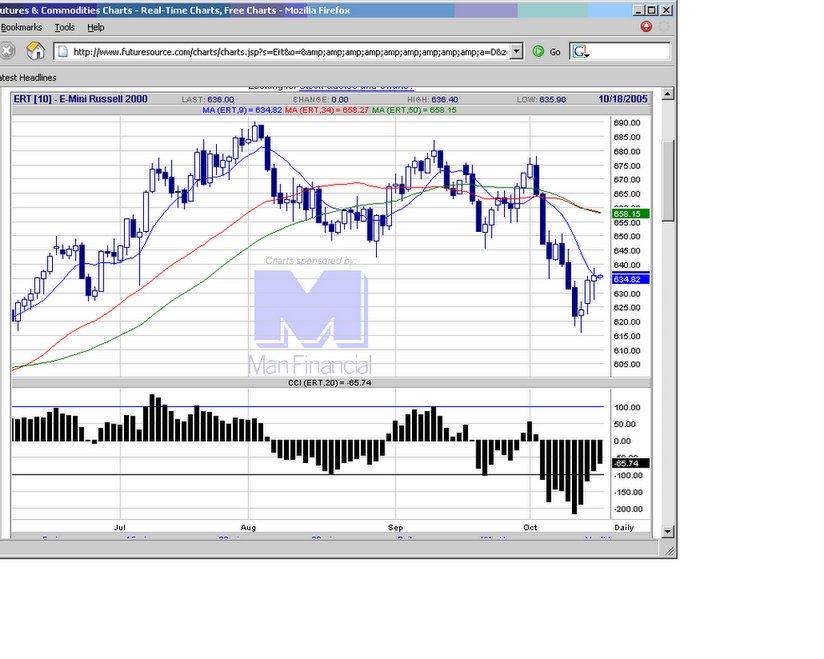
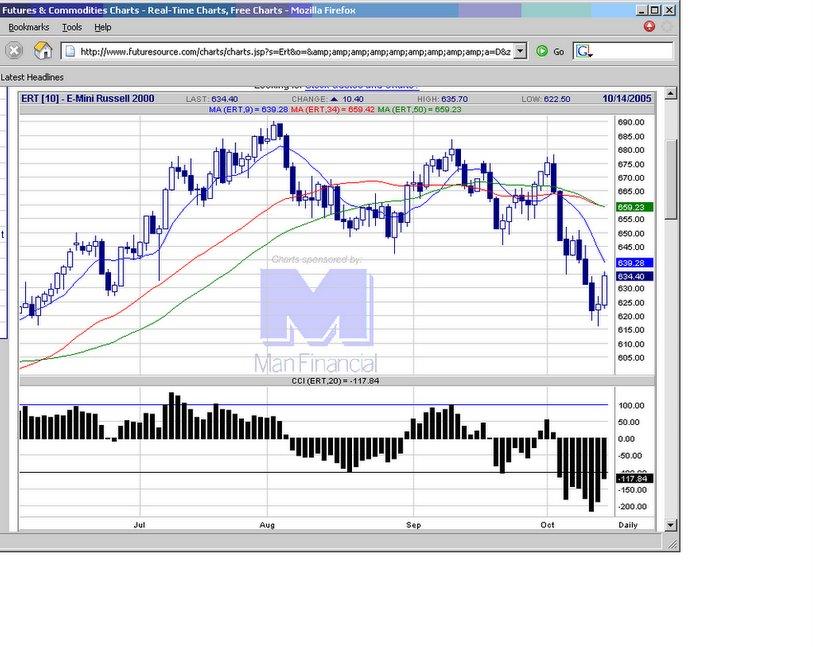
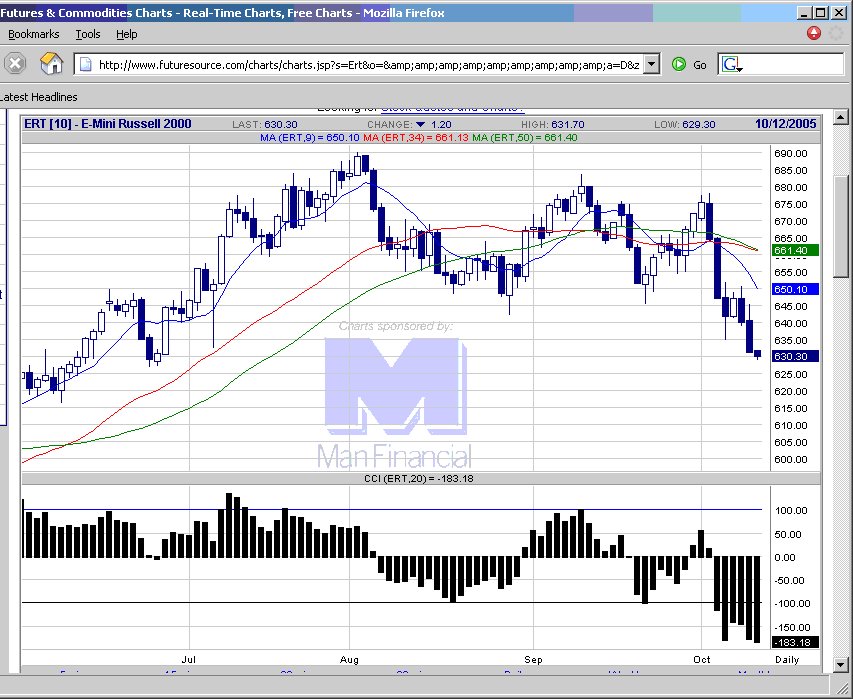
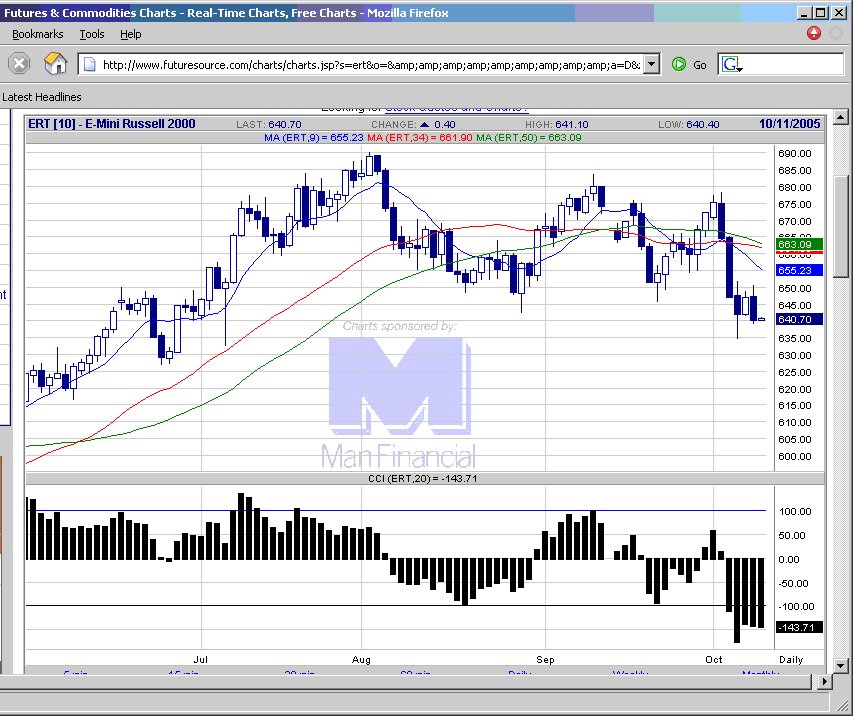
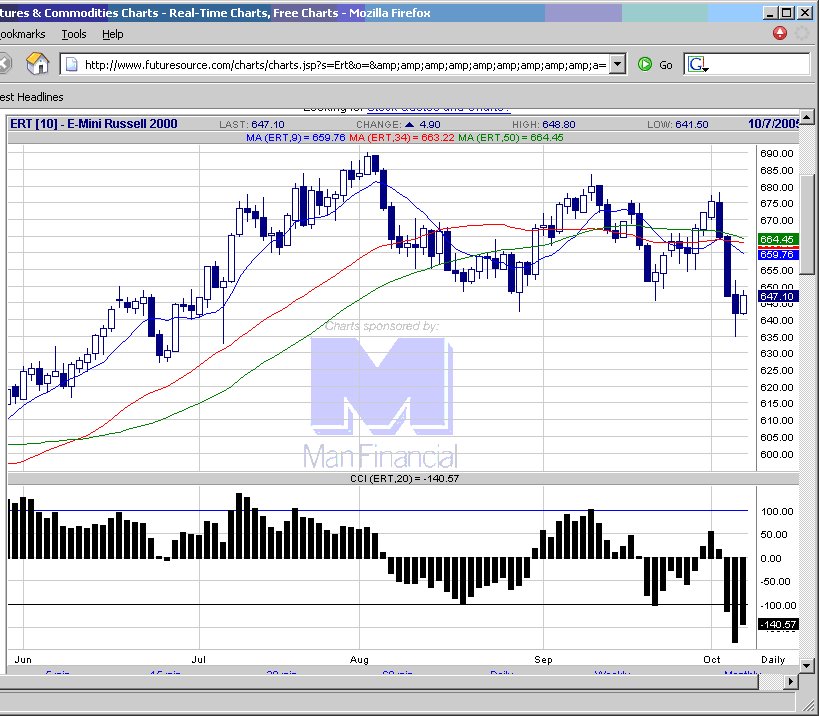
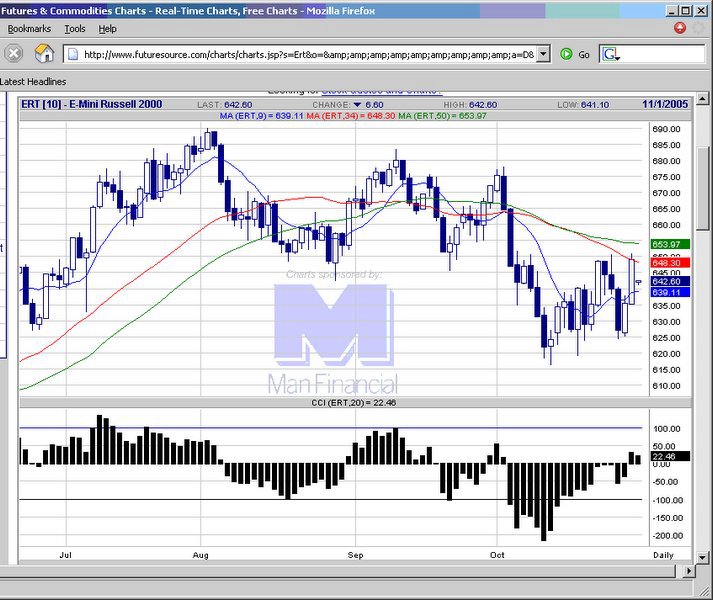
 20051031 Moving average level 648 provides some resistance. The market is now beyond the 'window ressing' after the tax loss selling activities in October, will have to wait and see what happens going forward.
  E-mini Russell 2000 chart
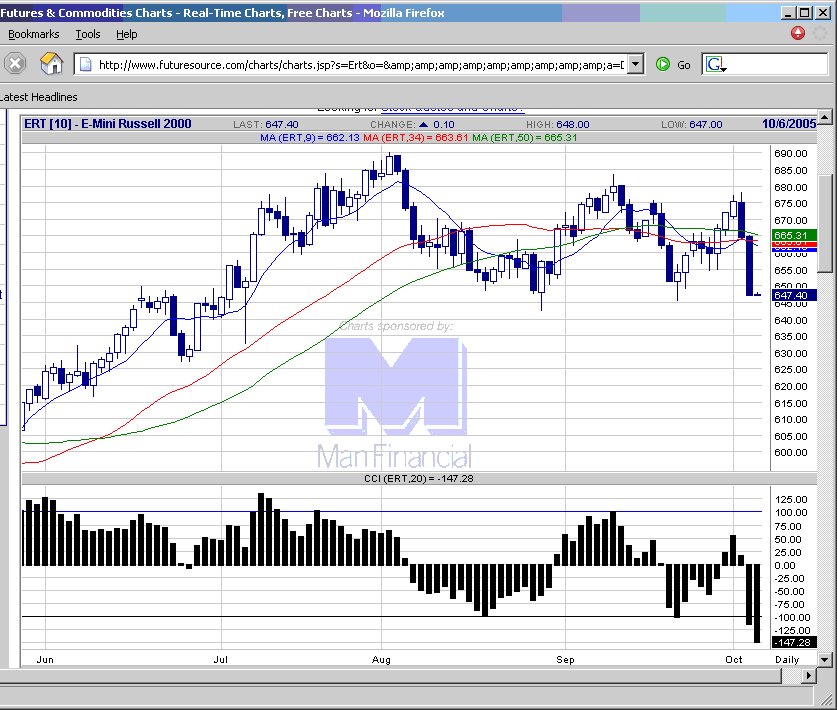
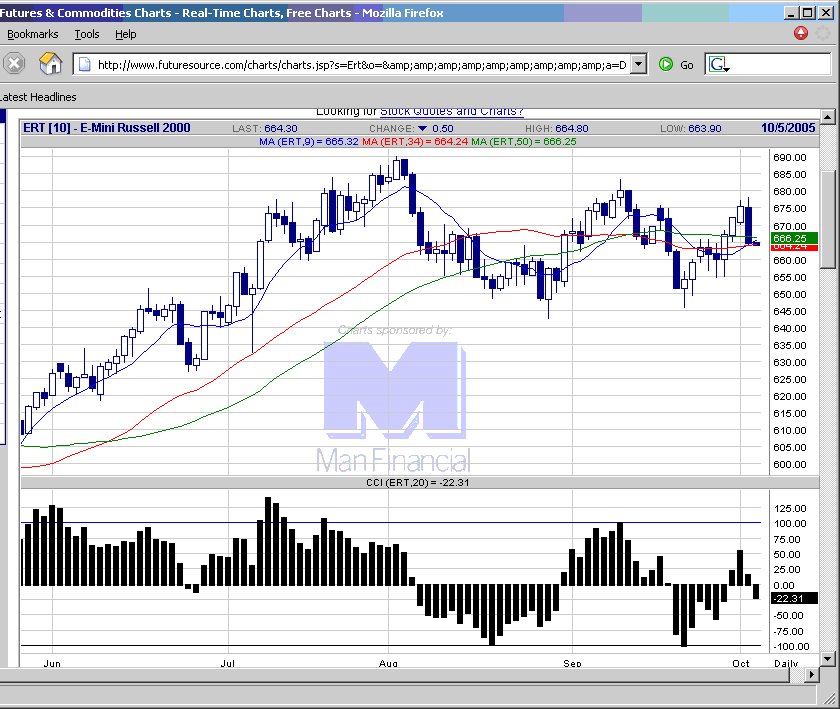
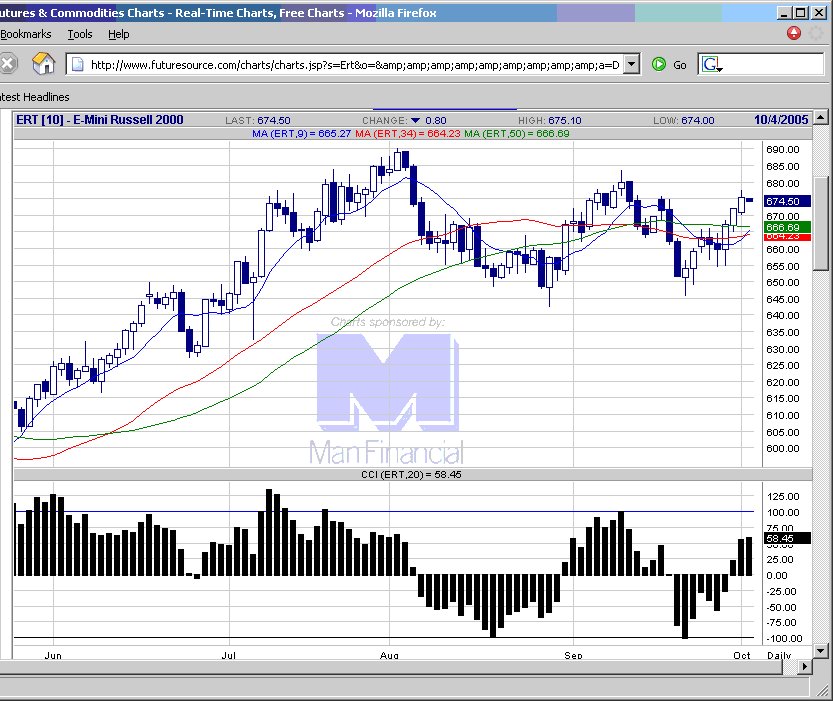
posted by emacro @ 4:07 PM
0 comments
![]()