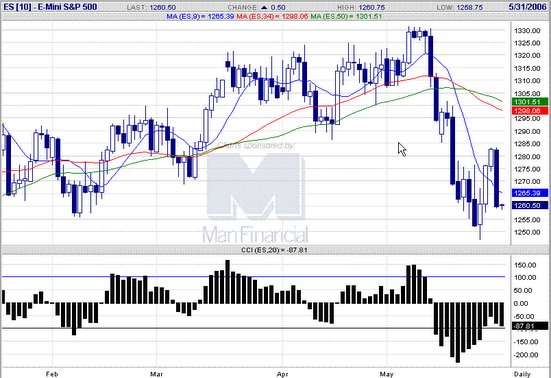
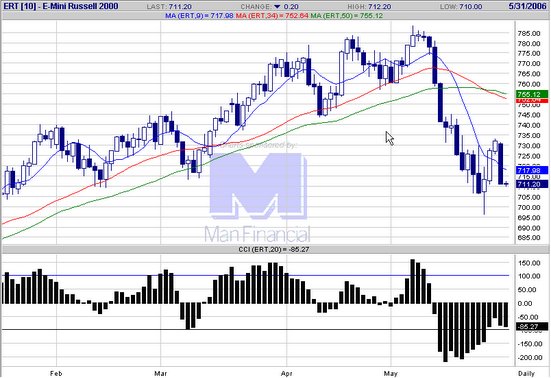
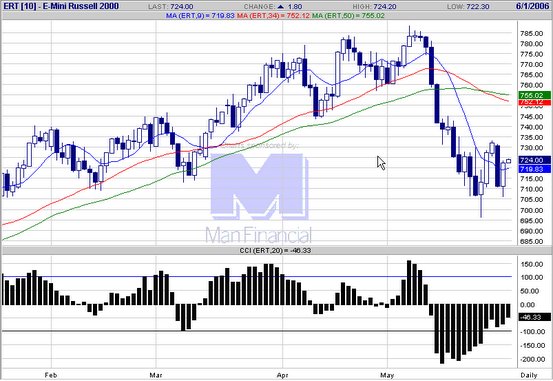
 20060531 On daily CCI looks to be a reversal in progress. Watching for 2 more days of gains.
  E-mini Russell 2000 chart
posted by emacro @ 6:11 PM
0 comments
![]()
Since 2004, the e-mini Russell 2000 futures has emerged as one of the favourite trading vehicle. It has advantages of providing cover and exposure to the small cap sector of the US equity markets, in addition to good volatility and intraday and interday trending characteristics. This educatinal site will chronicle trading in the contract.
20060531 On daily CCI looks to be a reversal in progress. Watching for 2 more days of gains.
E-mini Russell 2000 chart
posted by emacro @ 6:11 PM
0 comments
![]()
posted by emacro @ 5:16 PM
0 comments
![]()
posted by emacro @ 5:13 PM
0 comments
![]()
posted by emacro @ 7:58 PM
0 comments
![]()
posted by emacro @ 3:28 PM
0 comments
![]()
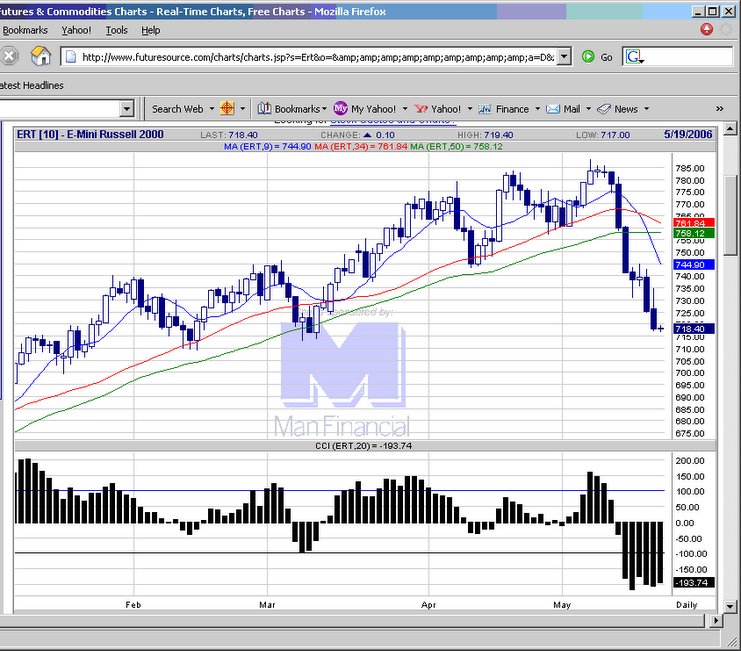
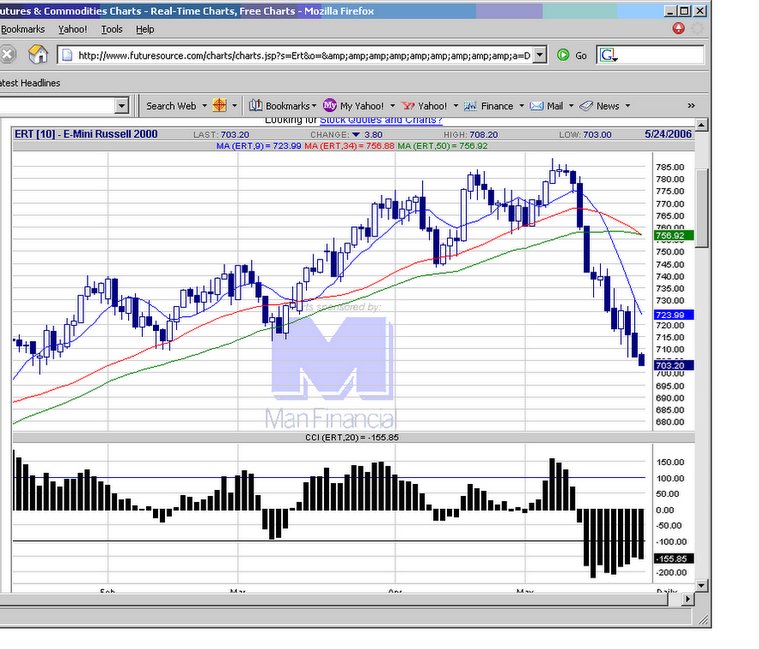 20060523 Early gains encountered resistance at the key moving average resistance.
E-mini Russell 2000 chart
20060523 Early gains encountered resistance at the key moving average resistance.
E-mini Russell 2000 chart
posted by emacro @ 5:45 PM
0 comments
![]()
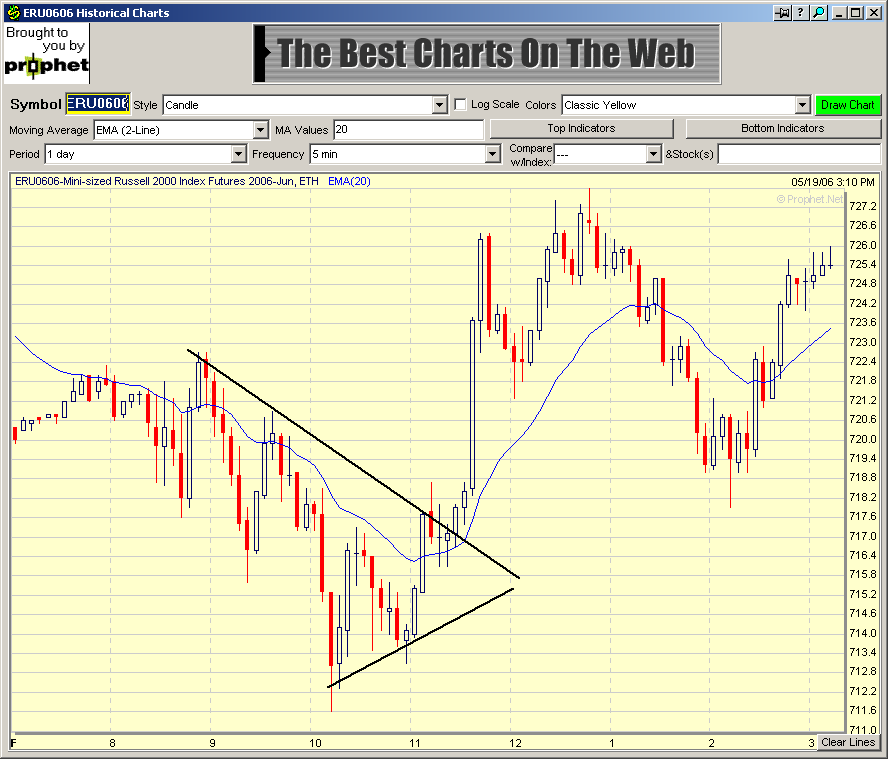
 20060519 Russell makes a hammer pattern, closing near highs. Should be continuation of rebound at least for another day or two.
E-mini Russell 2000 chart
20060519 Russell makes a hammer pattern, closing near highs. Should be continuation of rebound at least for another day or two.
E-mini Russell 2000 chart
posted by emacro @ 4:01 PM
0 comments
![]()
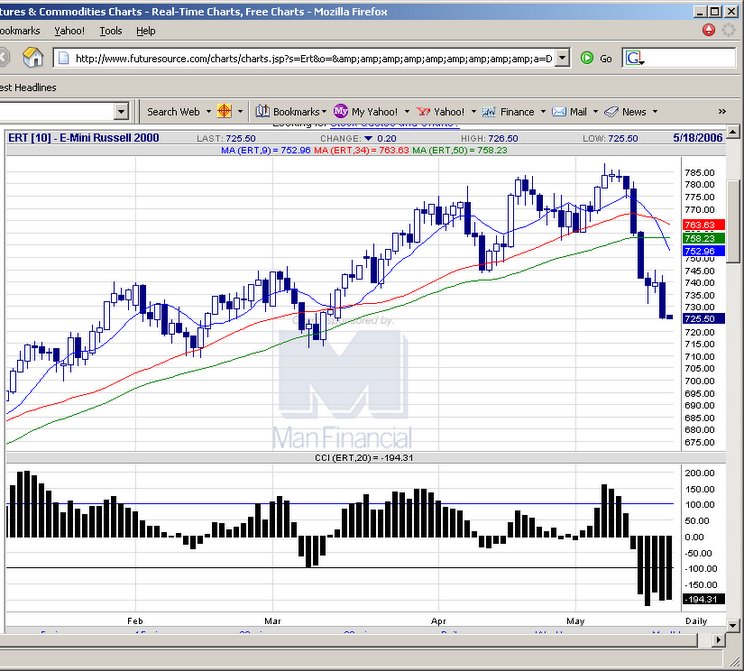
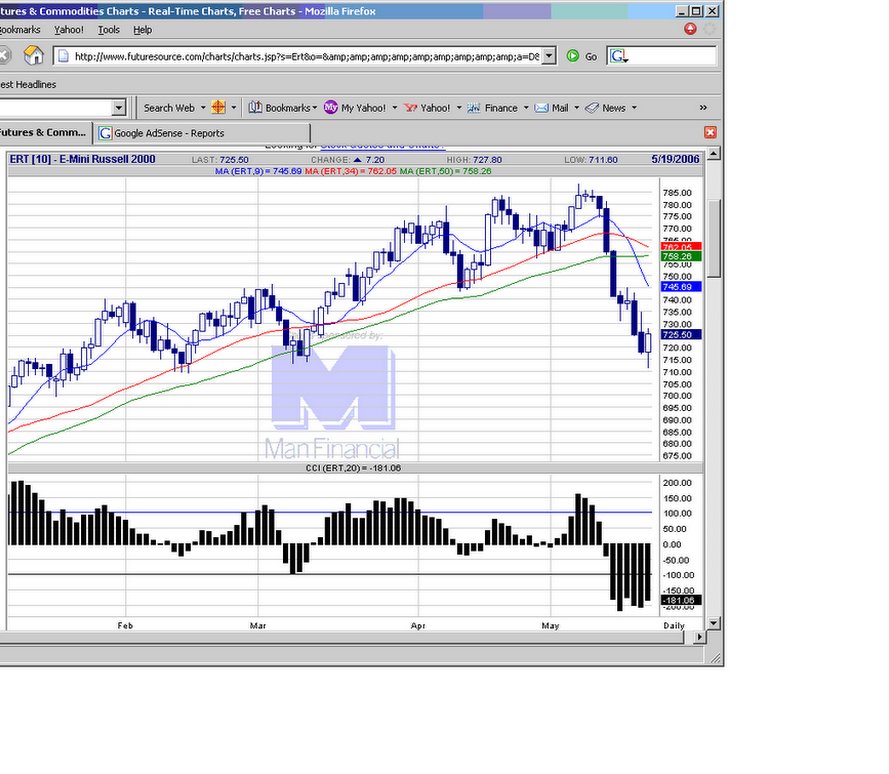
 20060518 After the expected opening bounce, Russell small caps continue down, dragged by the increasing CCI down momentum.
E-mini Russell 2000 chart
20060518 After the expected opening bounce, Russell small caps continue down, dragged by the increasing CCI down momentum.
E-mini Russell 2000 chart
posted by emacro @ 5:06 PM
0 comments
![]()
posted by emacro @ 2:34 PM
0 comments
![]()
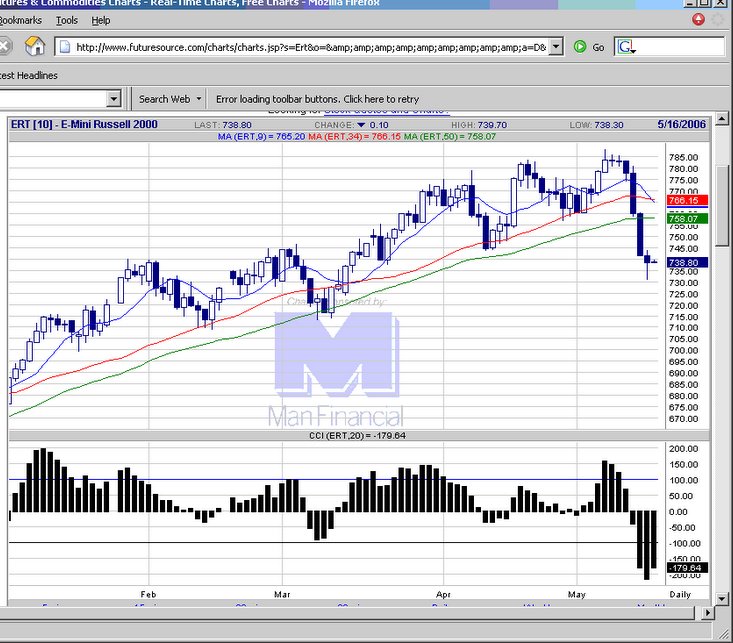
 20060516 Russell shows a 'spinning top' formation. Indecision ahead of the next move, which with CCI momentum on downside could be further down.
E-mini Russell 2000 chart
20060516 Russell shows a 'spinning top' formation. Indecision ahead of the next move, which with CCI momentum on downside could be further down.
E-mini Russell 2000 chart
posted by emacro @ 8:10 PM
0 comments
![]()
 20060515 Russell continues to move down. CCI momentum is still strongly indicative to downside.
E-mini Russell 2000 chart
20060515 Russell continues to move down. CCI momentum is still strongly indicative to downside.
E-mini Russell 2000 chart
posted by emacro @ 4:41 PM
0 comments
![]()
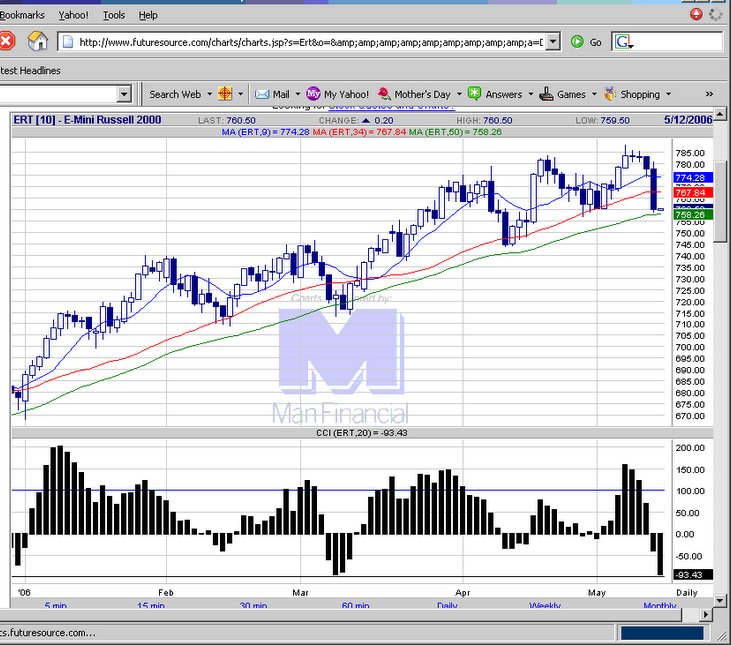
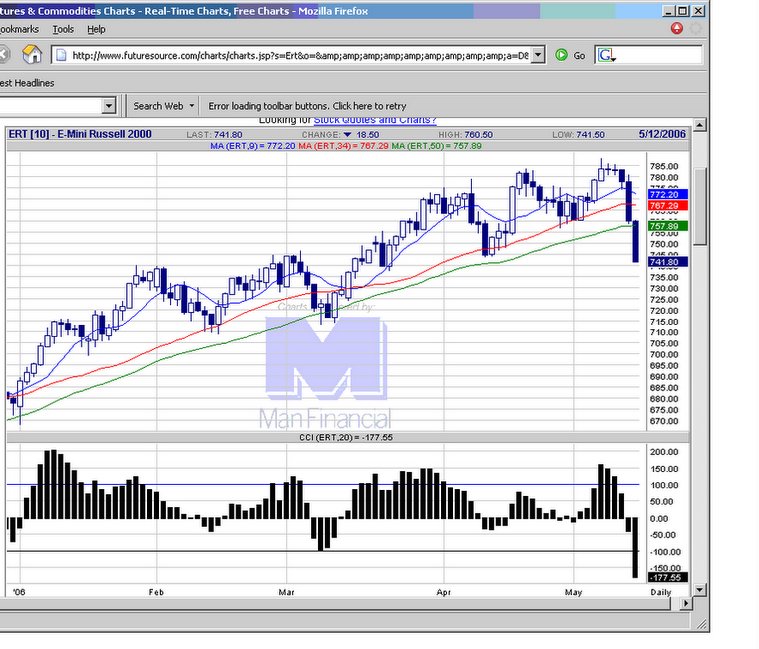 20060512 Russel may well have put in a triple top formation. Look for pullbacks to short on a position trade basis.
E-mini Russell 2000 chart
20060512 Russel may well have put in a triple top formation. Look for pullbacks to short on a position trade basis.
E-mini Russell 2000 chart
posted by emacro @ 6:01 PM
0 comments
![]()
posted by emacro @ 5:31 PM
0 comments
![]()
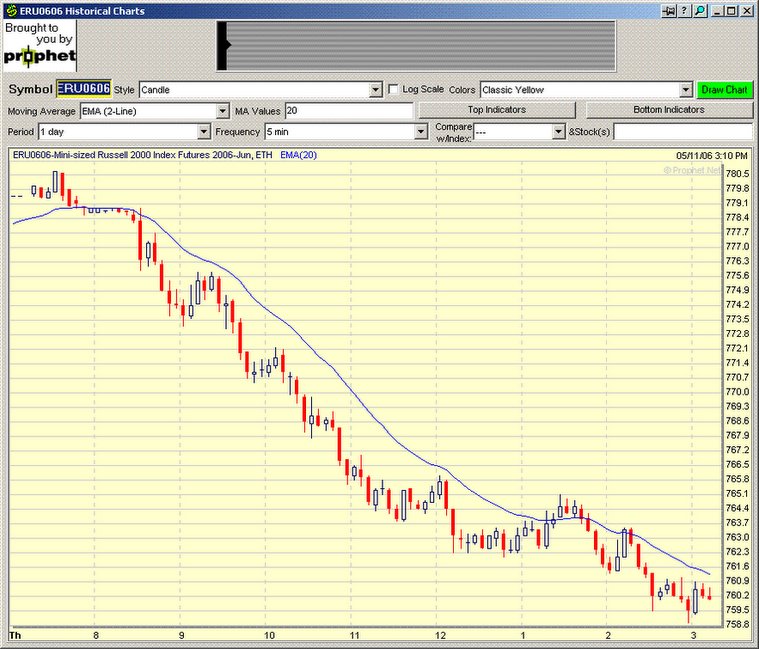
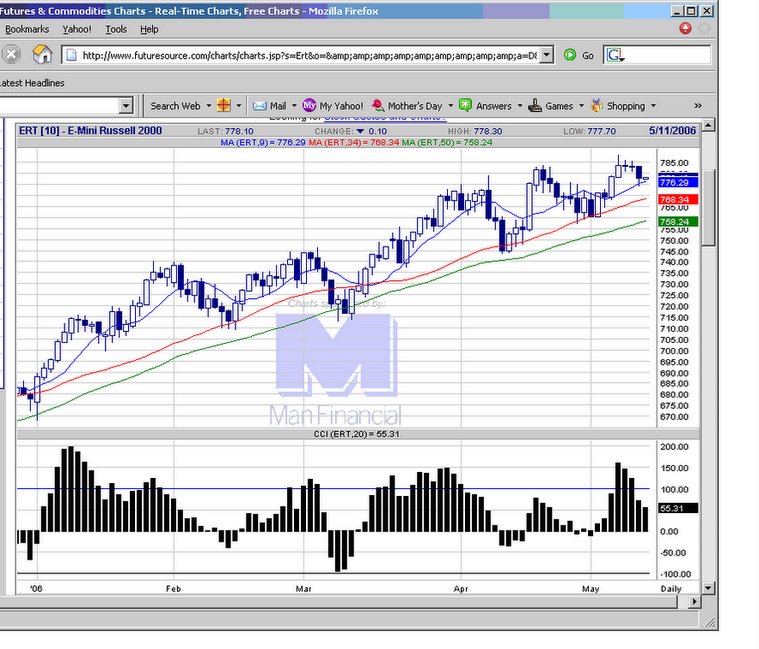
 20060511 Russell, breaks through support at 774.20, which now becomes resistance. CCI momentum indicates major support is broken, could be in for a longer correction.
E-mini Russell 2000 chart
20060511 Russell, breaks through support at 774.20, which now becomes resistance. CCI momentum indicates major support is broken, could be in for a longer correction.
E-mini Russell 2000 chart
posted by emacro @ 5:18 PM
0 comments
![]()
 20060510 Russell had a good 20+ pt travel from the ZLR buy signal. Now coming down to test mov avg support levels.
E-mini Russell 2000 chart
20060510 Russell had a good 20+ pt travel from the ZLR buy signal. Now coming down to test mov avg support levels.
E-mini Russell 2000 chart
posted by emacro @ 10:18 PM
0 comments
![]()
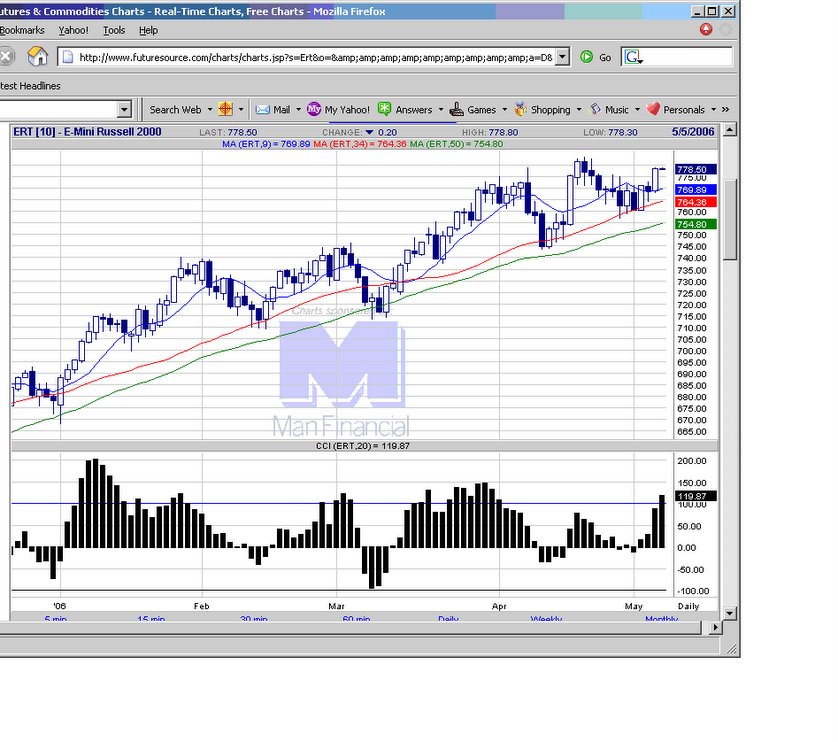
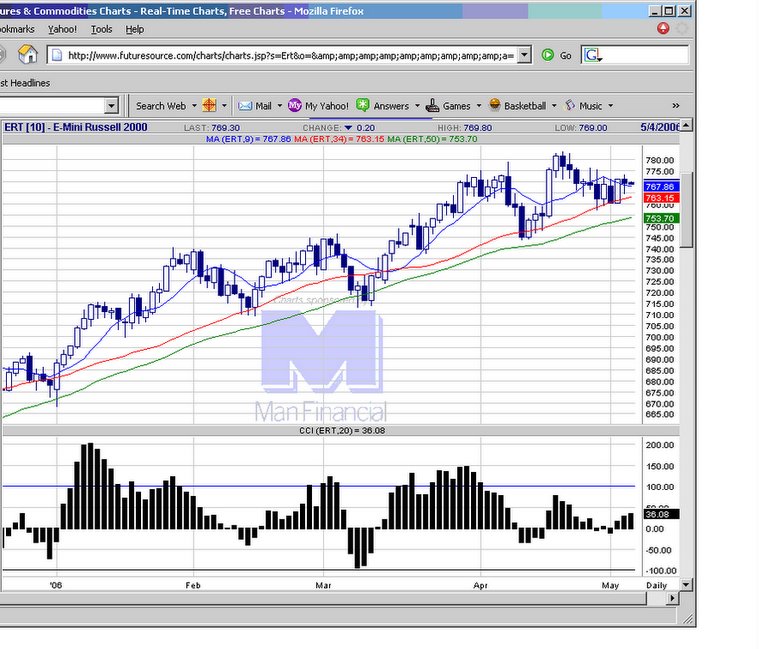
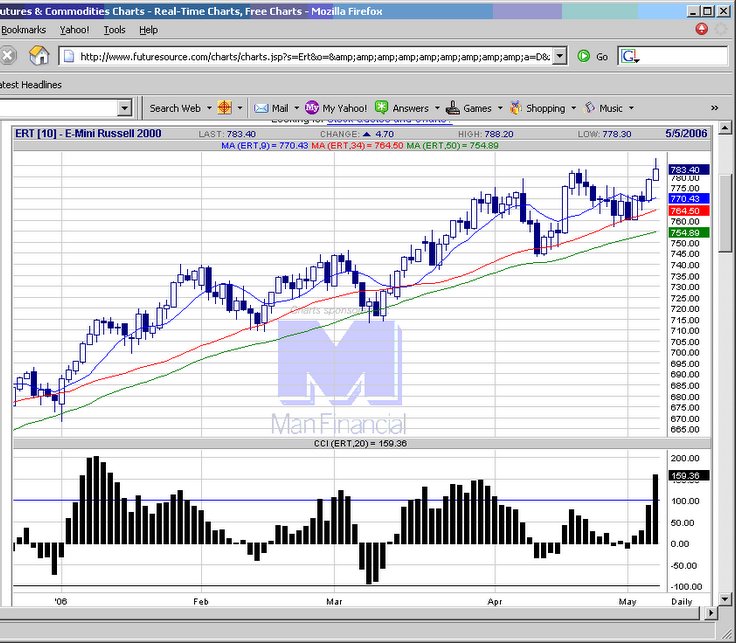 20060505 Russell 2000, follows through further on the ZLR buy signal, probably reacting to favorable NFP data.
E-mini Russell 2000 chart
20060505 Russell 2000, follows through further on the ZLR buy signal, probably reacting to favorable NFP data.
E-mini Russell 2000 chart
posted by emacro @ 8:56 PM
0 comments
![]()
posted by emacro @ 7:21 PM
0 comments
![]()
posted by emacro @ 5:42 PM
0 comments
![]()
posted by emacro @ 5:47 PM
0 comments
![]()