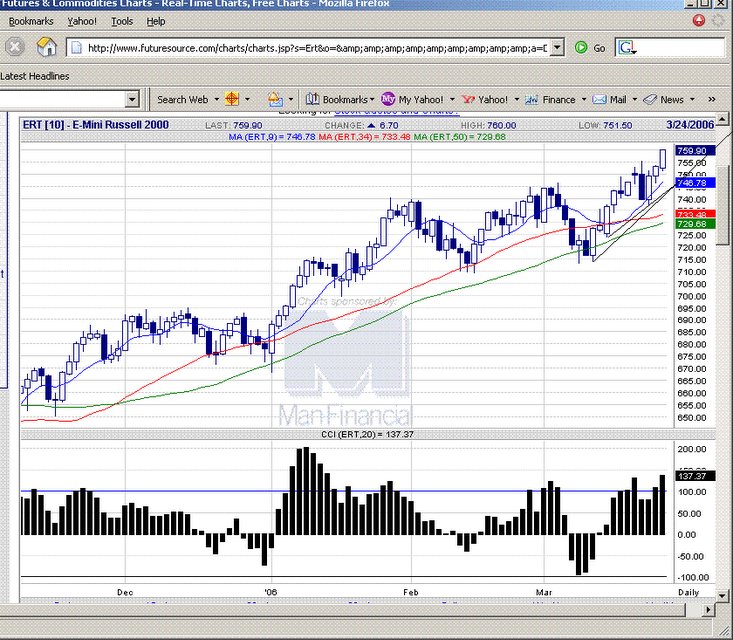
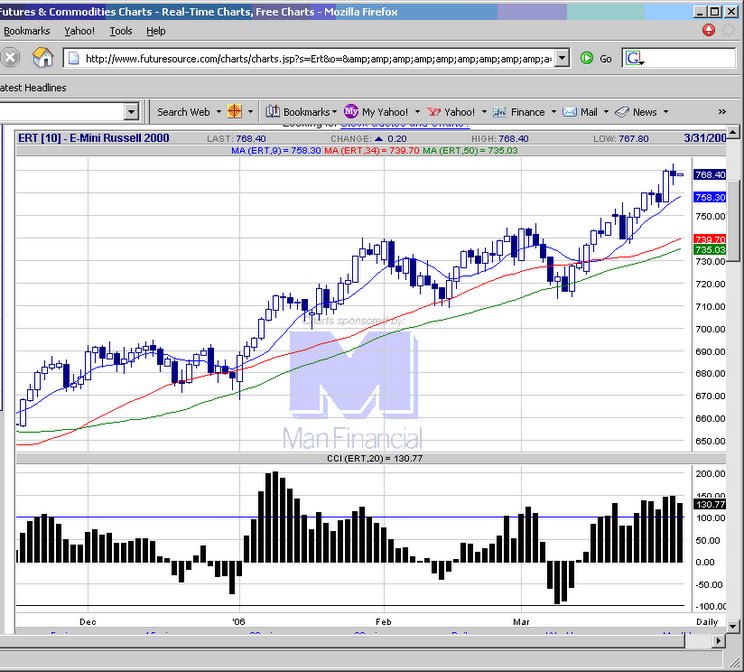
 20060330 Russell technicals still look strong despite the pullback in the Dow today.
  E-mini Russell 2000 chart
posted by emacro @ 4:30 PM
0 comments
![]()
Since 2004, the e-mini Russell 2000 futures has emerged as one of the favourite trading vehicle. It has advantages of providing cover and exposure to the small cap sector of the US equity markets, in addition to good volatility and intraday and interday trending characteristics. This educatinal site will chronicle trading in the contract.
20060330 Russell technicals still look strong despite the pullback in the Dow today.
E-mini Russell 2000 chart
posted by emacro @ 4:30 PM
0 comments
![]()
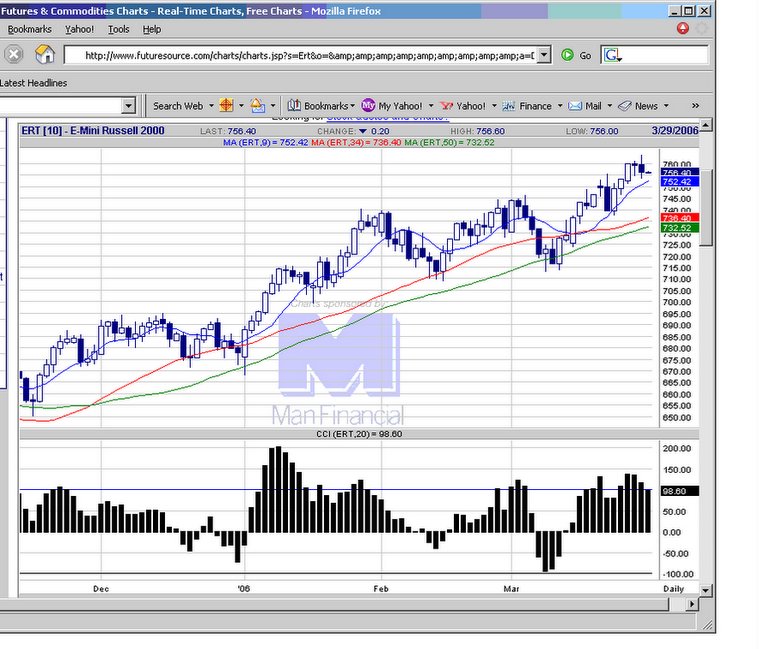 20060328 FOMC interest rate decision day, with B Bernanke presiding as chairman for th efirst time. Candlestick shows a inverted hammer, with engulfing bearish formation on the Russell futures. Market unable to hold initial gains, sells off after the interest rate decision.
E-mini Russell 2000 chart
20060328 FOMC interest rate decision day, with B Bernanke presiding as chairman for th efirst time. Candlestick shows a inverted hammer, with engulfing bearish formation on the Russell futures. Market unable to hold initial gains, sells off after the interest rate decision.
E-mini Russell 2000 chart
posted by emacro @ 4:25 PM
0 comments
![]()
posted by emacro @ 6:55 PM
0 comments
![]()
posted by emacro @ 4:28 PM
0 comments
![]()
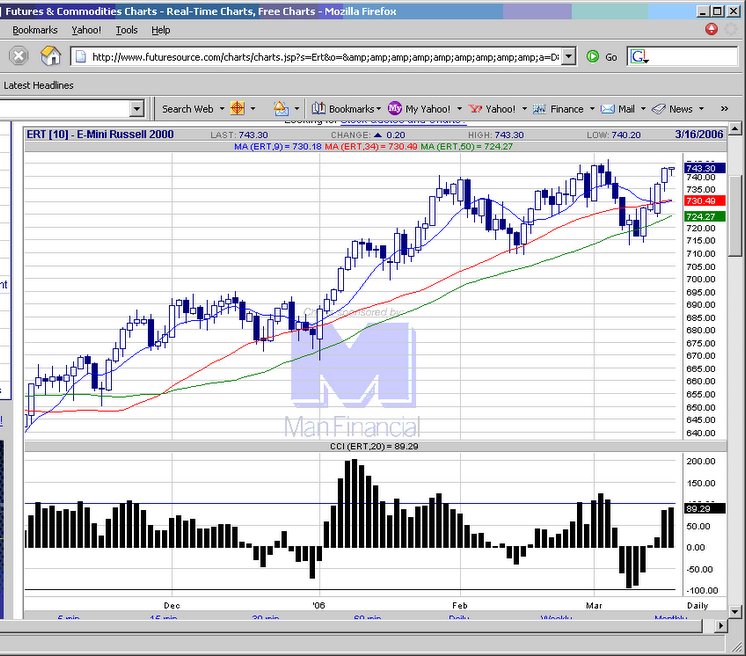
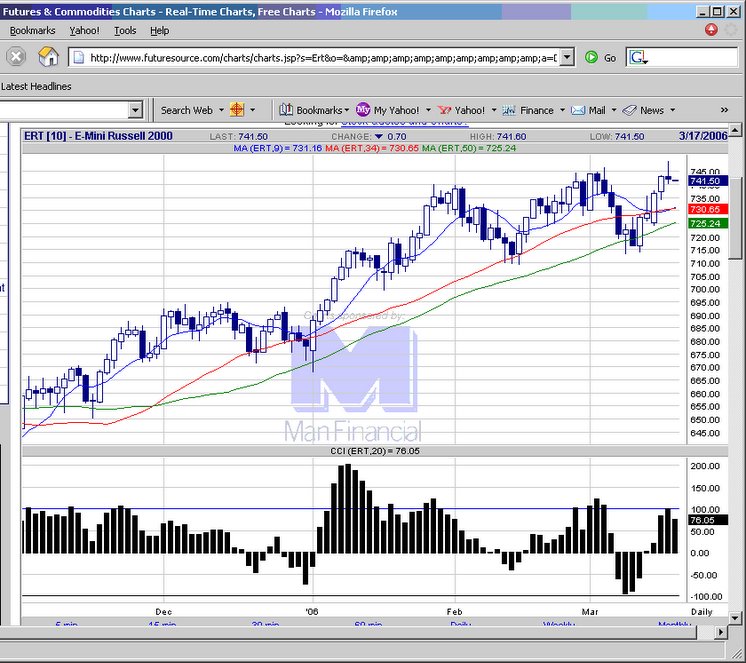
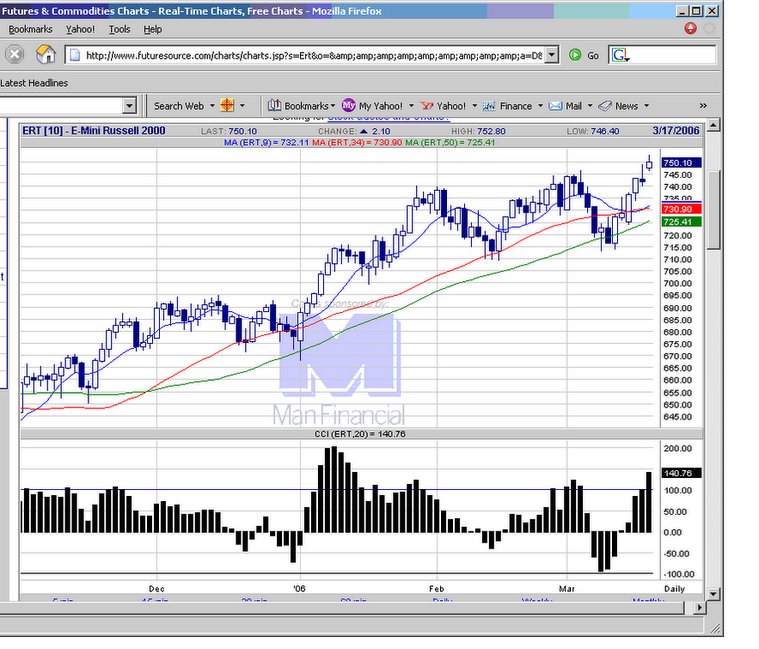 20060317 Russell 2000 futures continues its strength on options/futures expiration day.
E-mini Russell 2000 chart
20060317 Russell 2000 futures continues its strength on options/futures expiration day.
E-mini Russell 2000 chart
posted by emacro @ 6:51 PM
0 comments
![]()
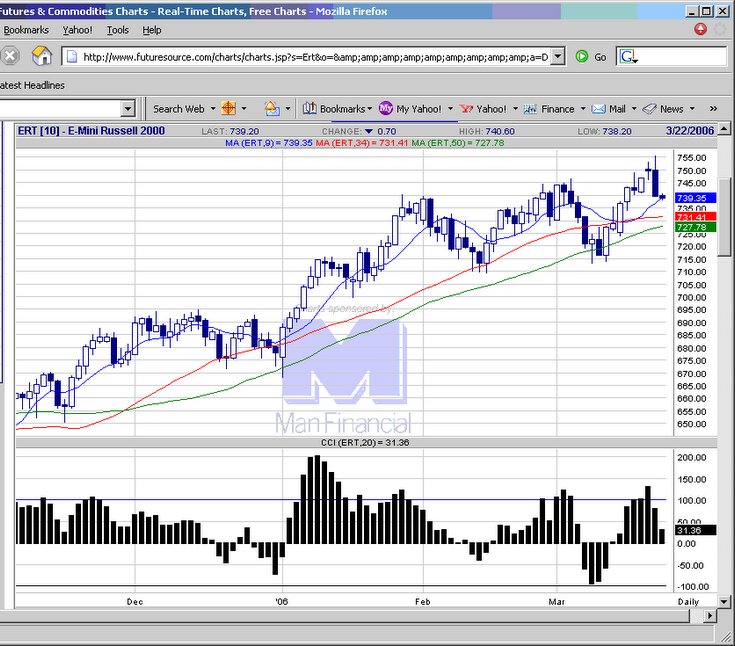
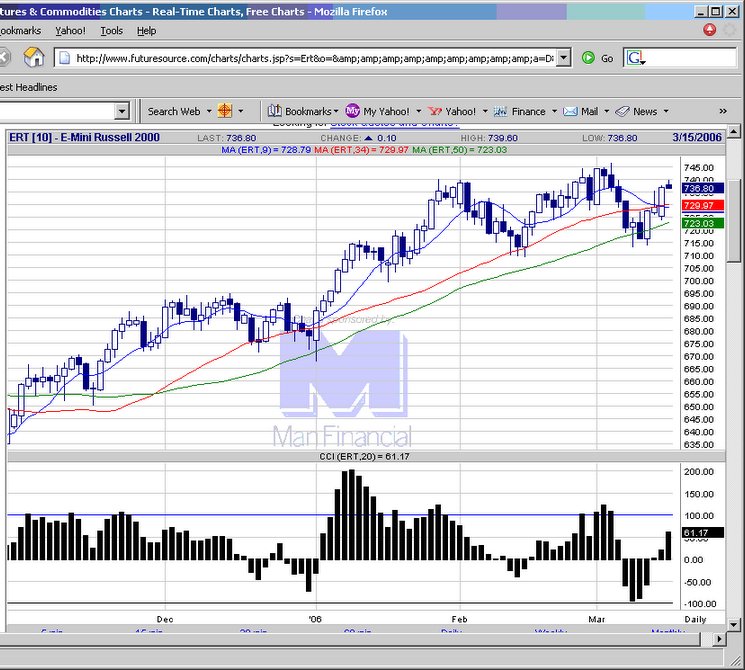
 20060316 Russell futures show bearish reversal candle, and close below last 20 day high indicates a turtle soup reversal short trade.
E-mini Russell 2000 chart
20060316 Russell futures show bearish reversal candle, and close below last 20 day high indicates a turtle soup reversal short trade.
E-mini Russell 2000 chart
posted by emacro @ 5:03 PM
0 comments
![]()
posted by emacro @ 4:22 PM
0 comments
![]()
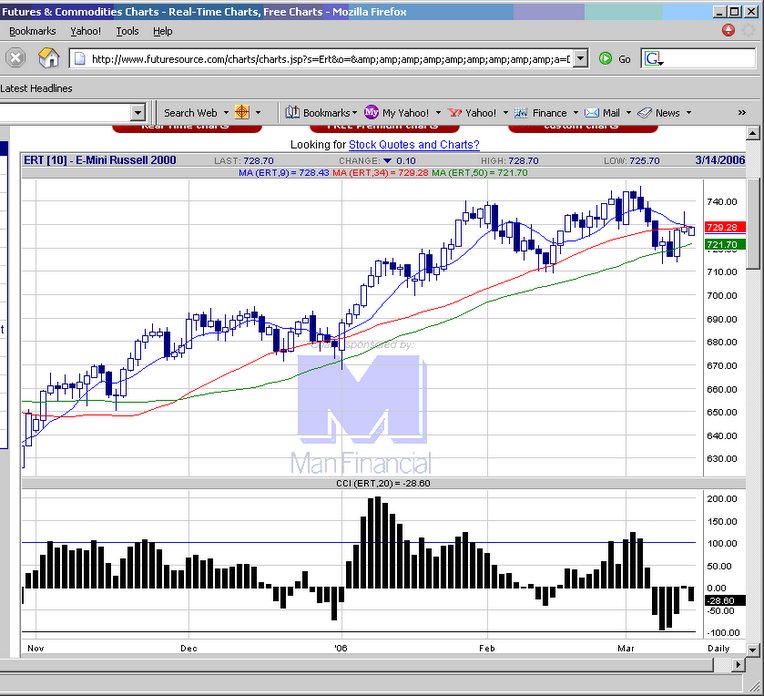
 20060314 Big white candlestick indicates buyers stepping up, but needs to take out the high to confirm continuation of uptrend.
E-mini Russell 2000 chart
20060314 Big white candlestick indicates buyers stepping up, but needs to take out the high to confirm continuation of uptrend.
E-mini Russell 2000 chart
posted by emacro @ 4:11 PM
0 comments
![]()
 20060313 Strength in the morning gives way to selling later in the day. This forms a bearish shooting star candle formation.
E-mini Russell 2000 chart
20060313 Strength in the morning gives way to selling later in the day. This forms a bearish shooting star candle formation.
E-mini Russell 2000 chart
posted by emacro @ 4:10 PM
0 comments
![]()
posted by emacro @ 5:49 PM
0 comments
![]()
posted by emacro @ 5:43 PM
0 comments
![]()
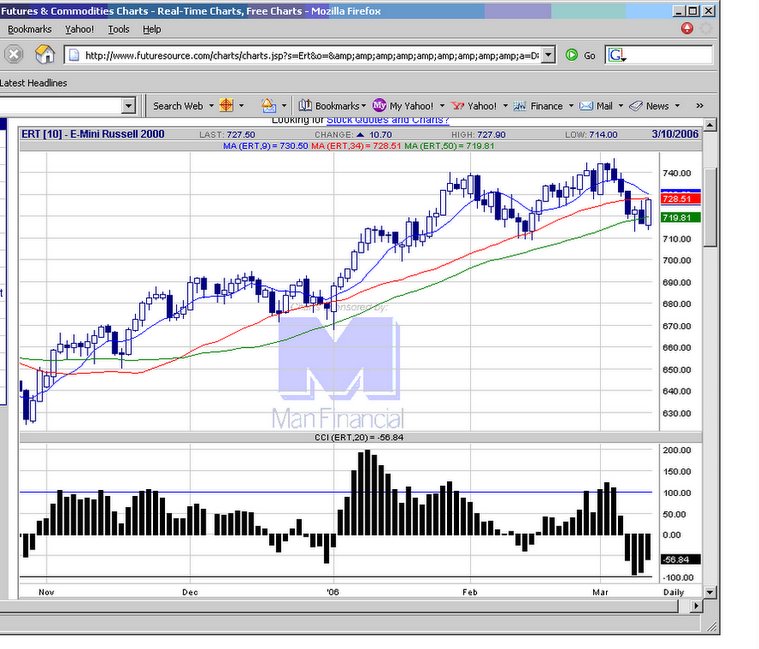
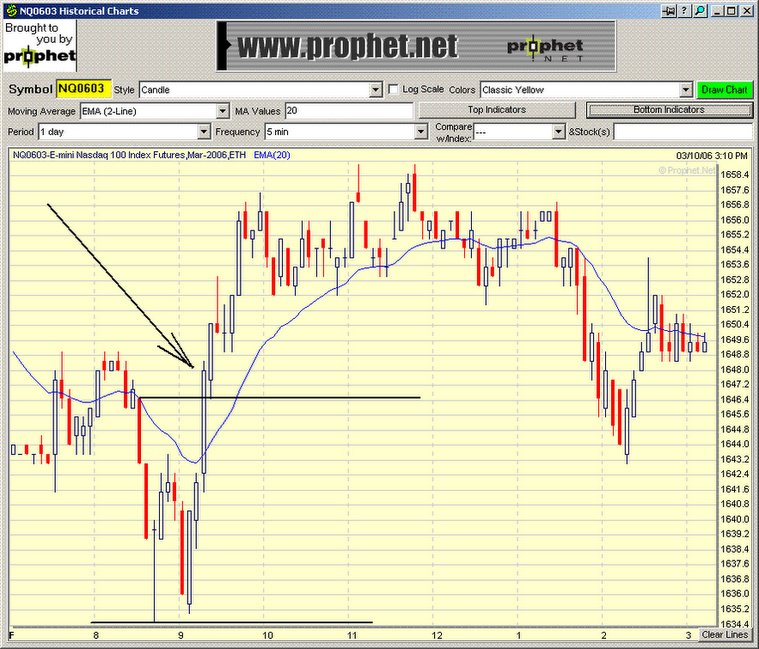
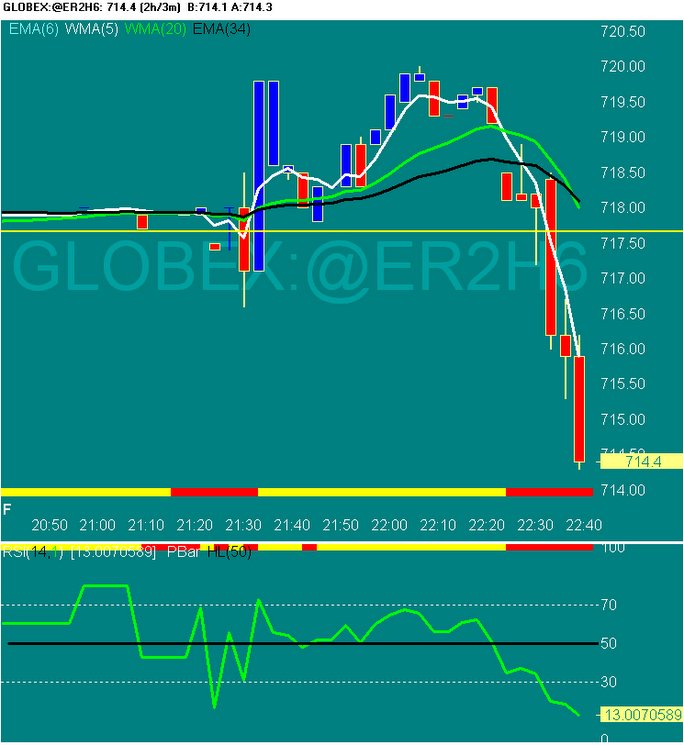
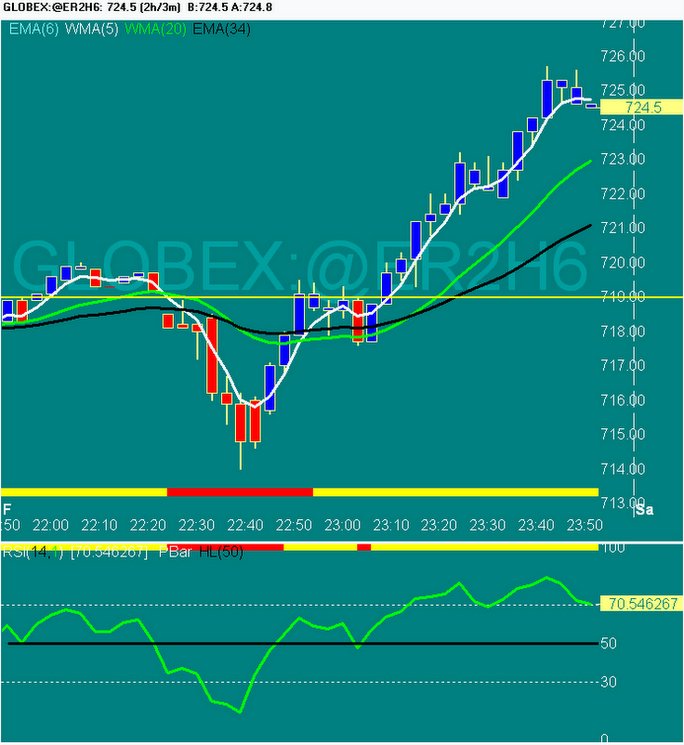 20060310 10:52 am EST. Moving avg crossed at 717.40, we long on cross of trigger price at 719. Nice move up.
E-mini Russell 2000 chart
20060310 10:52 am EST. Moving avg crossed at 717.40, we long on cross of trigger price at 719. Nice move up.
E-mini Russell 2000 chart
posted by emacro @ 7:53 AM
0 comments
![]()
posted by emacro @ 6:52 AM
0 comments
![]()
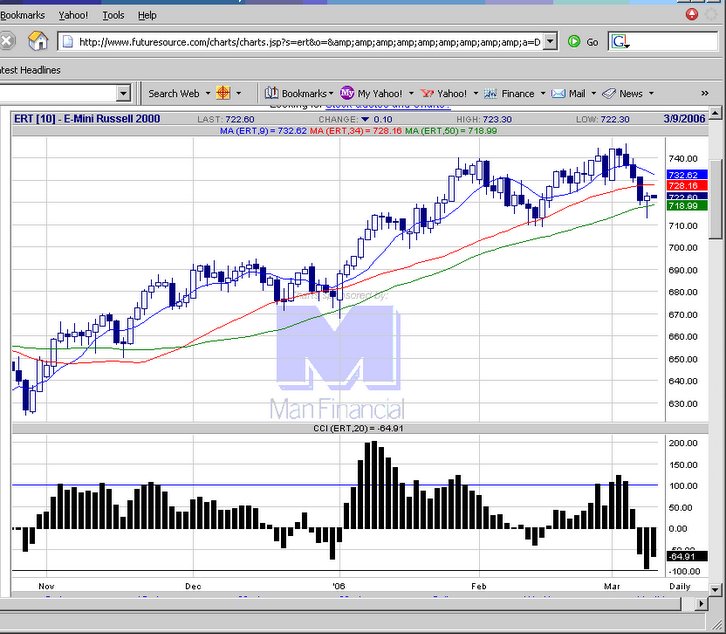
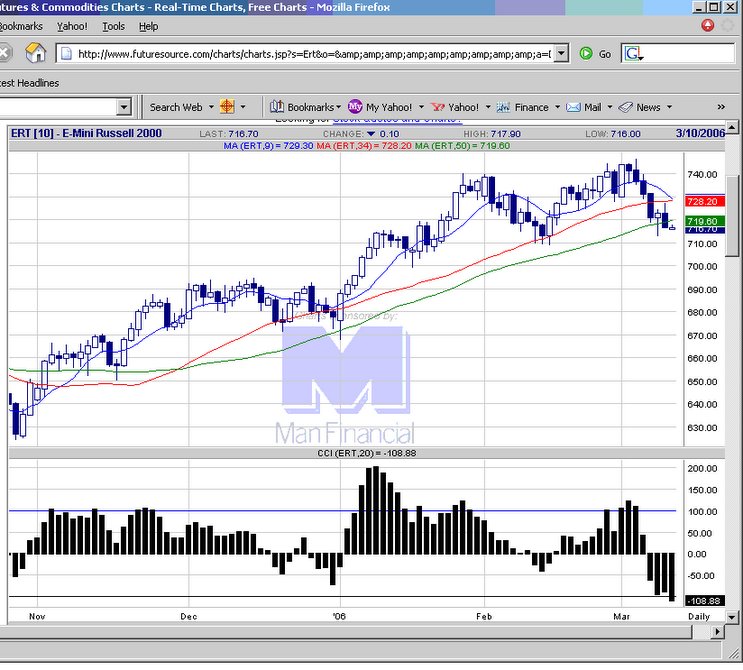 20060309 Russell ends weak. The expected strength on the open did materialise, but was unable to sustain, indicating the supply/demand equation shifts to down now.
E-mini Russell 2000 chart
20060309 Russell ends weak. The expected strength on the open did materialise, but was unable to sustain, indicating the supply/demand equation shifts to down now.
E-mini Russell 2000 chart
posted by emacro @ 6:02 PM
0 comments
![]()
posted by emacro @ 3:40 PM
0 comments
![]()
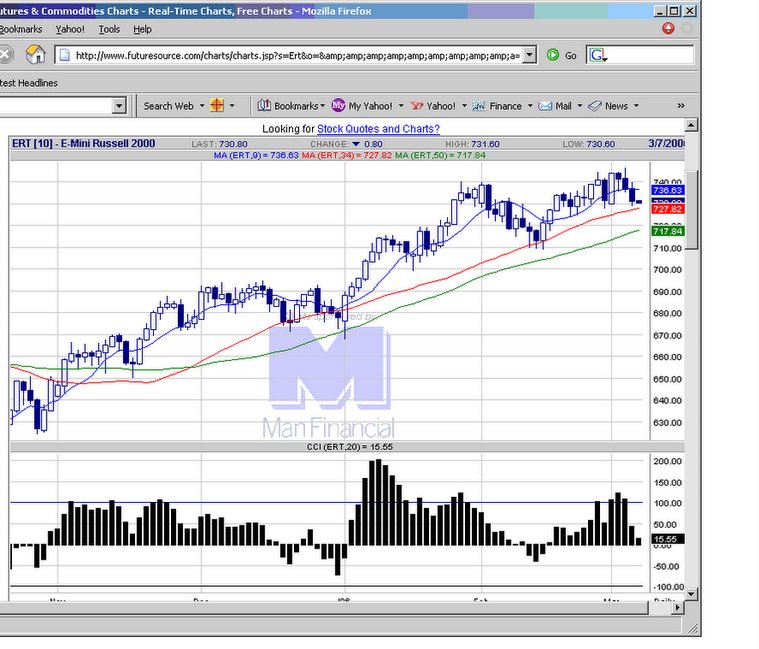
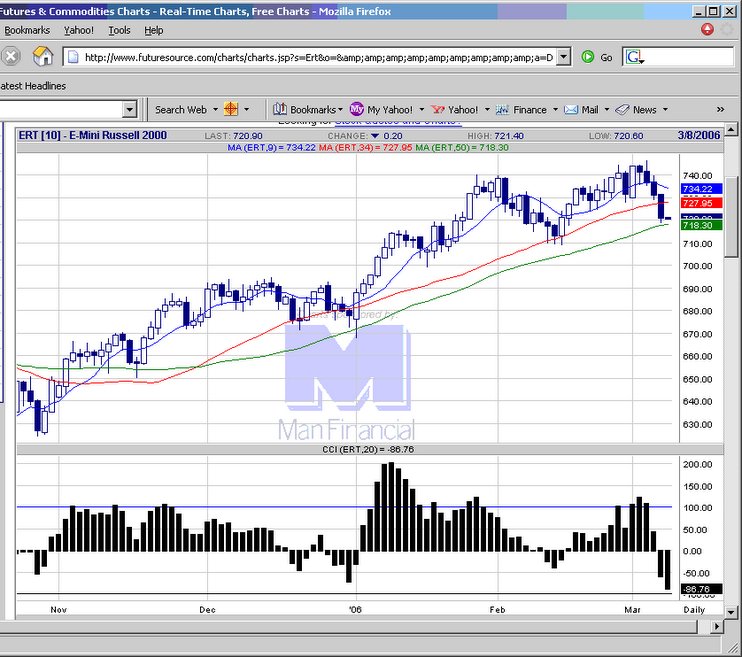 20060307 Russell broke key moving average support we alluded to yesterday, might consolidate around this current 50 day mov avg support.
E-mini Russell 2000 chart
20060307 Russell broke key moving average support we alluded to yesterday, might consolidate around this current 50 day mov avg support.
E-mini Russell 2000 chart
posted by emacro @ 3:55 PM
0 comments
![]()
posted by emacro @ 6:00 PM
0 comments
![]()
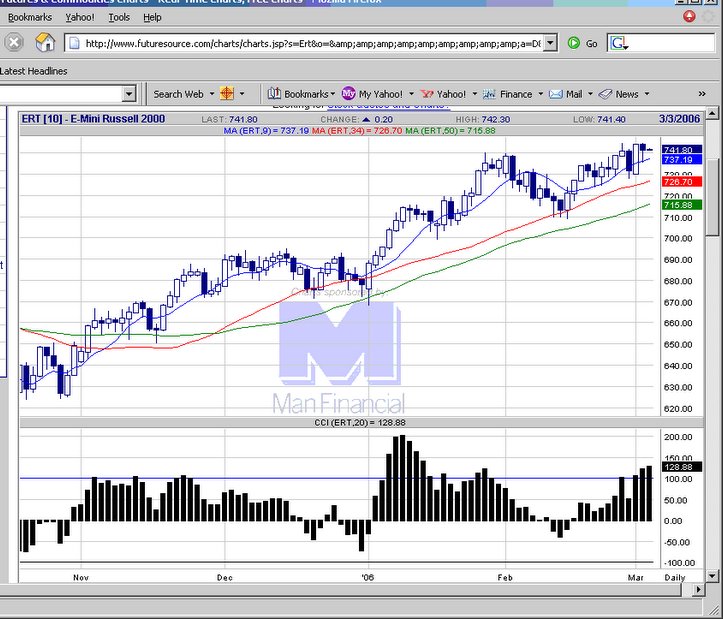
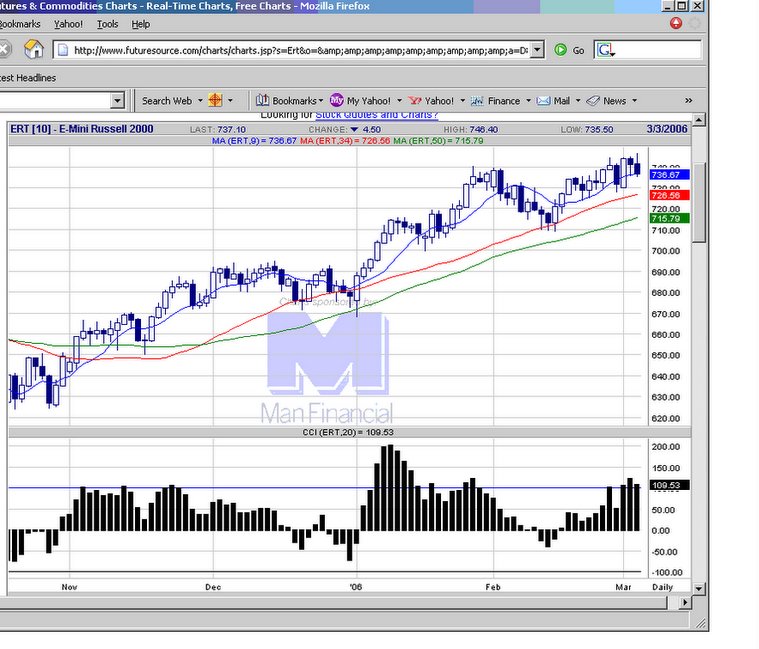 20060303 730 remains key support, if broken next week could be completion of 123 pattern reversal.
E-mini Russell 2000 chart
20060303 730 remains key support, if broken next week could be completion of 123 pattern reversal.
E-mini Russell 2000 chart
posted by emacro @ 5:35 PM
0 comments
![]()
posted by emacro @ 4:43 PM
0 comments
![]()
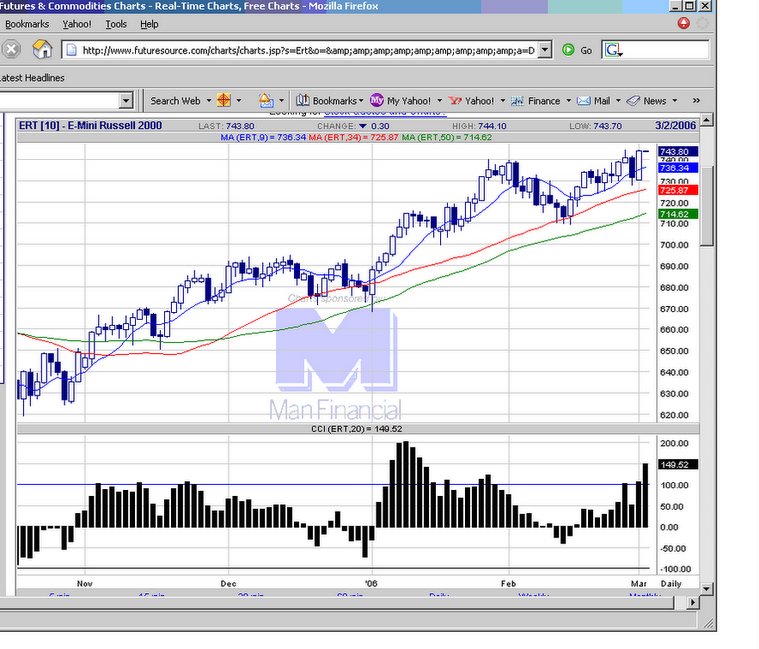 20060302 An engulfing bullish candle nd cmplete reversal from the previous day losses.
E-mini Russell 2000 chart
20060302 An engulfing bullish candle nd cmplete reversal from the previous day losses.
E-mini Russell 2000 chart
posted by emacro @ 4:00 PM
0 comments
![]()