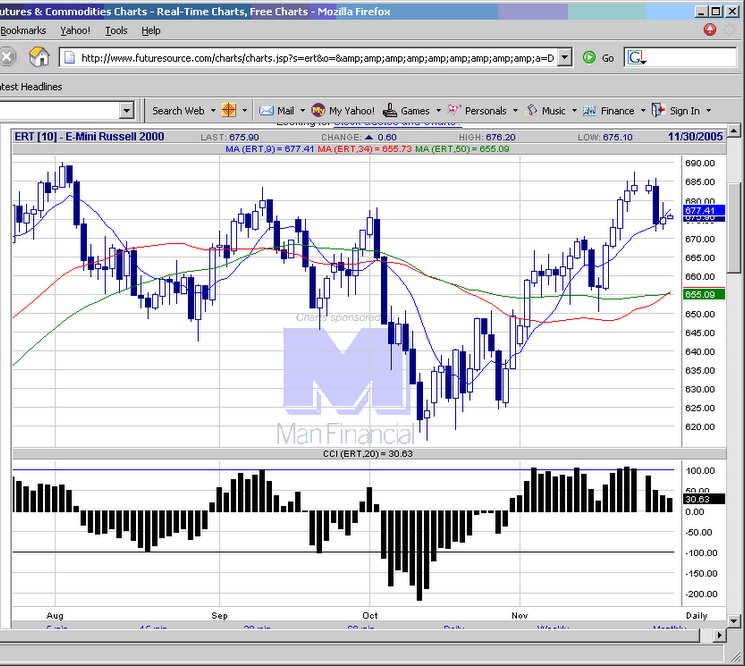
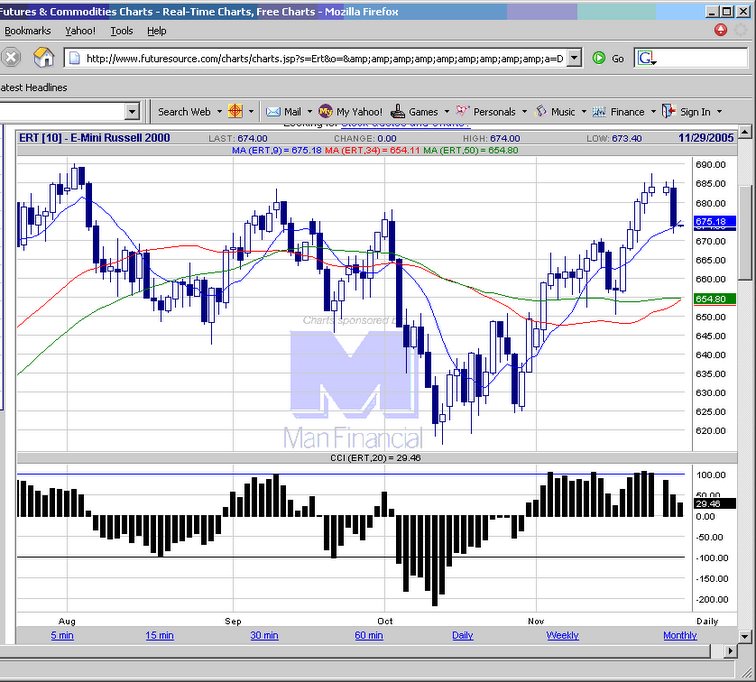
 20051129 Russell is holding at the 9 ema support, which if holds, lends to a view of the retest of the highs. However CCI momentum is slowing.
  E-mini Russell 2000 chart
posted by emacro @ 3:56 PM
0 comments
![]()
Since 2004, the e-mini Russell 2000 futures has emerged as one of the favourite trading vehicle. It has advantages of providing cover and exposure to the small cap sector of the US equity markets, in addition to good volatility and intraday and interday trending characteristics. This educatinal site will chronicle trading in the contract.
20051129 Russell is holding at the 9 ema support, which if holds, lends to a view of the retest of the highs. However CCI momentum is slowing.
E-mini Russell 2000 chart
posted by emacro @ 3:56 PM
0 comments
![]()
 20051128 A retracement to rest on the moving average support, would be looking for another ZLR to climb aboard the uptrend.
E-mini Russell 2000 chart
20051128 A retracement to rest on the moving average support, would be looking for another ZLR to climb aboard the uptrend.
E-mini Russell 2000 chart
posted by emacro @ 3:47 PM
0 comments
![]()
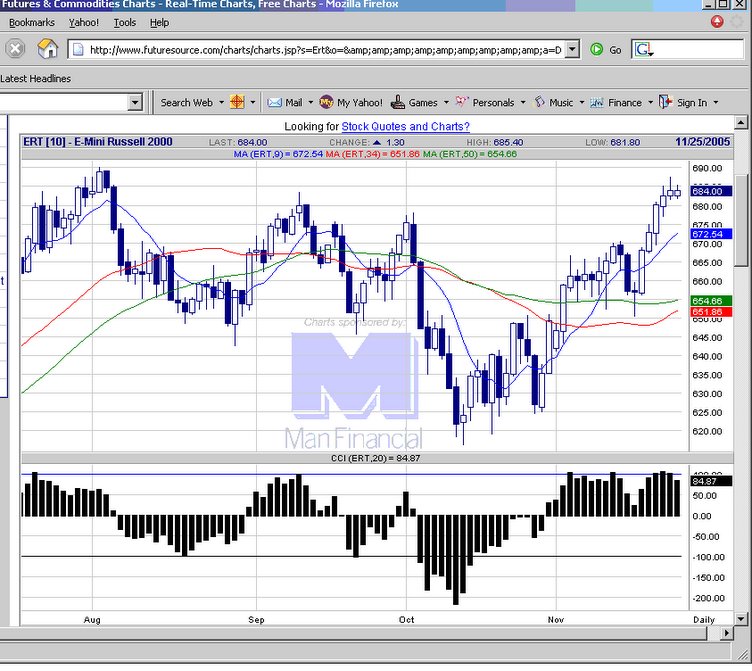 20051125 Waiting for pullback to the movings to long and climb on board the bull.
E-mini Russell 2000 chart
20051125 Waiting for pullback to the movings to long and climb on board the bull.
E-mini Russell 2000 chart
posted by emacro @ 6:25 PM
0 comments
![]()
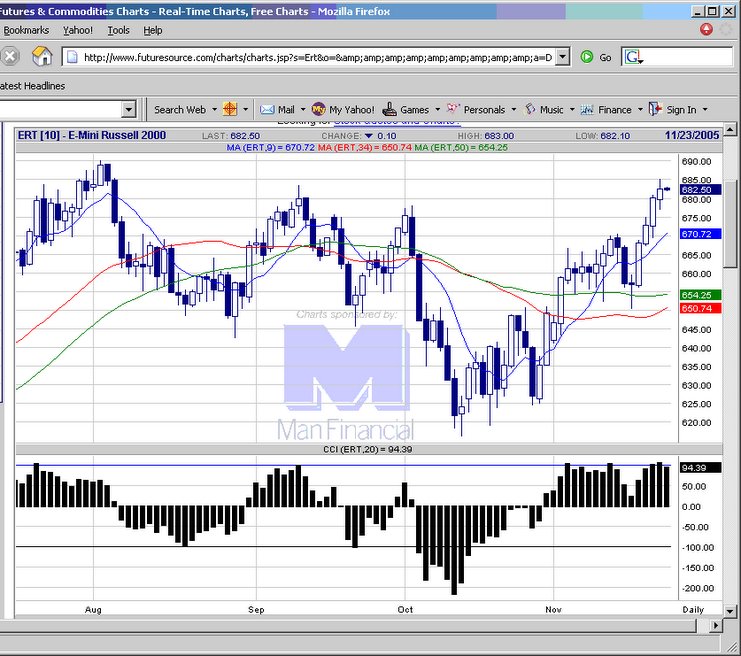
 20051123 Surprise in the consumer sentiment figures powers Russell futures higher, again.
E-mini Russell 2000 chart
20051123 Surprise in the consumer sentiment figures powers Russell futures higher, again.
E-mini Russell 2000 chart
posted by emacro @ 5:10 PM
0 comments
![]()
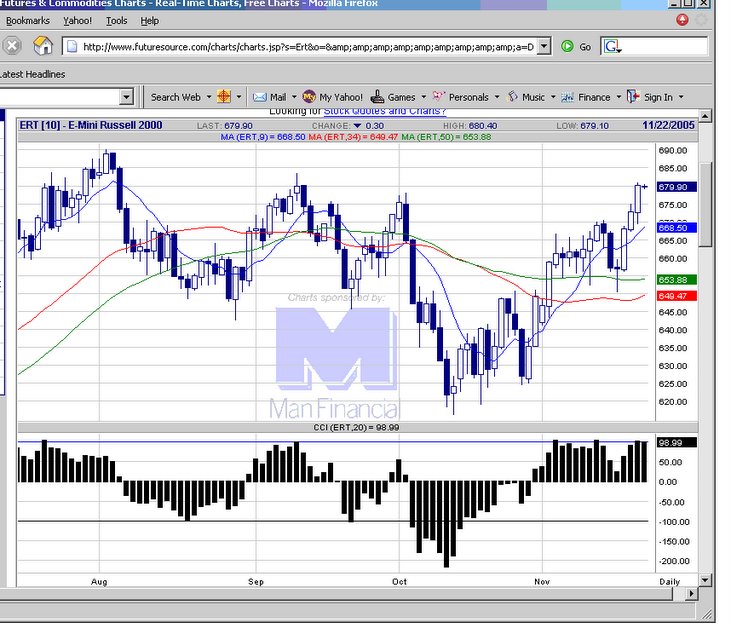
 20051122 Powers higher on the Fed minutes, that could spel the slowdown in the interest rate hike cycle.
E-mini Russell 2000 chart
20051122 Powers higher on the Fed minutes, that could spel the slowdown in the interest rate hike cycle.
E-mini Russell 2000 chart
posted by emacro @ 5:58 PM
0 comments
![]()
 20051121 Higher on continuatin of the momentum generated from the ZLR buy signal.
E-mini Russell 2000 chart
20051121 Higher on continuatin of the momentum generated from the ZLR buy signal.
E-mini Russell 2000 chart
posted by emacro @ 4:02 PM
0 comments
![]()
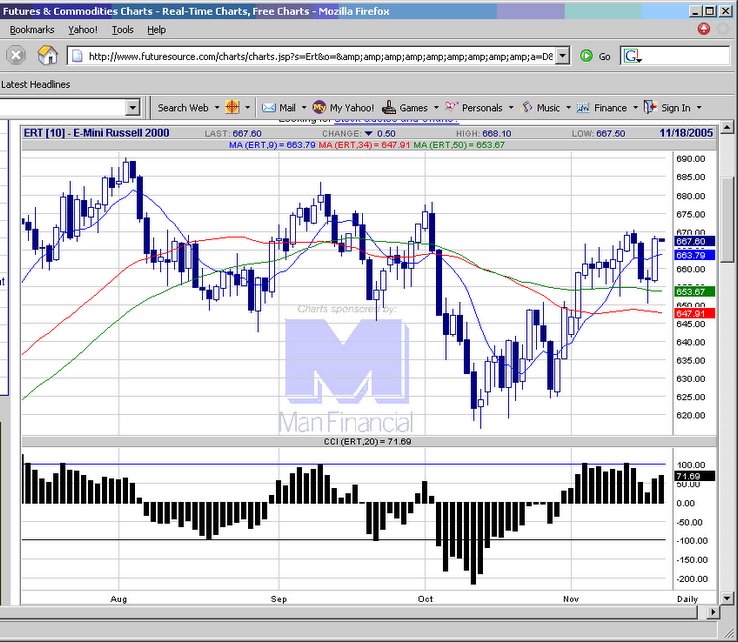
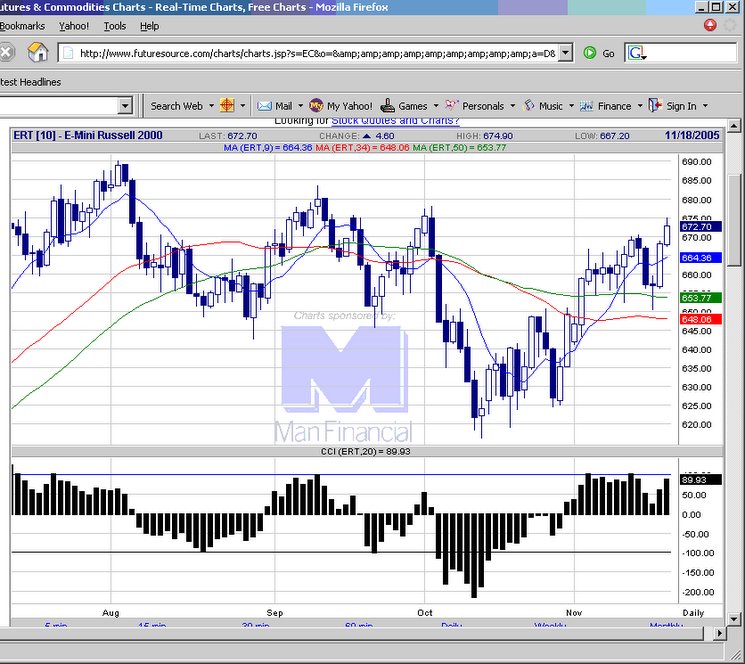 20051118 Further strength on options expiration day. 678 is key resistance, a possible level to look for scalp shorts.
E-mini Russell 2000 chart
20051118 Further strength on options expiration day. 678 is key resistance, a possible level to look for scalp shorts.
E-mini Russell 2000 chart
posted by emacro @ 2:42 AM
0 comments
![]()
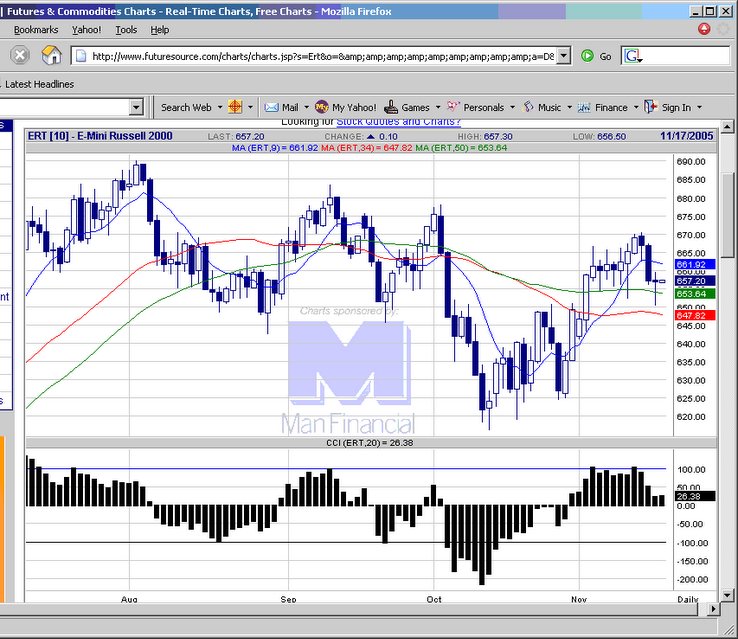
 20051117 A ZLR buy signal is in force, might be good to bid to buy on pullbacks.
E-mini Russell 2000 chart
20051117 A ZLR buy signal is in force, might be good to bid to buy on pullbacks.
E-mini Russell 2000 chart
posted by emacro @ 5:02 PM
0 comments
![]()
posted by emacro @ 11:30 PM
0 comments
![]()
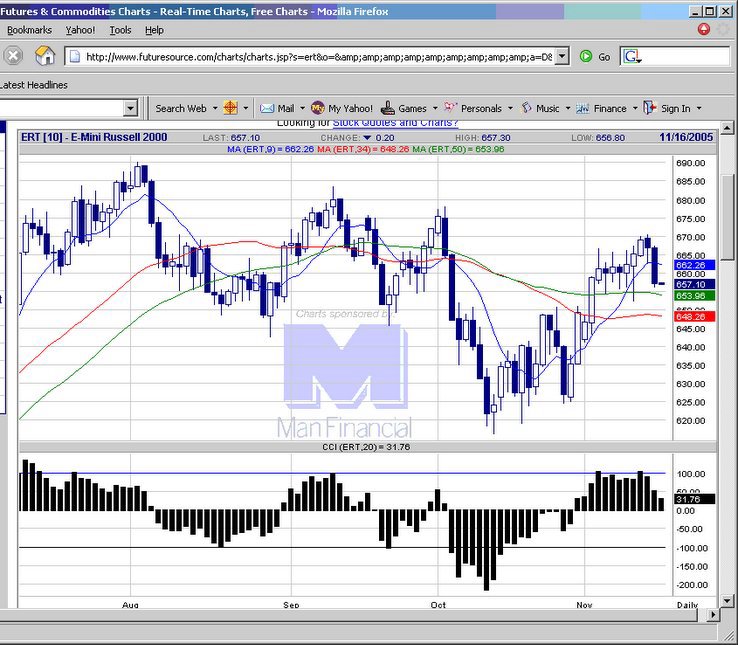 20051115 Breaks below the 9 ema support. Big black candlestick indicates selling interest. Should see further weakness, at least into the opening on Wednesday.
E-mini Russell 2000 chart
20051115 Breaks below the 9 ema support. Big black candlestick indicates selling interest. Should see further weakness, at least into the opening on Wednesday.
E-mini Russell 2000 chart
posted by emacro @ 4:22 PM
0 comments
![]()
 20051114 Russell came down tag the moving average and ends off lows. However market is extended, selling rallies or buying some Dec puts at the money might be a trading idea.
E-mini Russell 2000 chart
20051114 Russell came down tag the moving average and ends off lows. However market is extended, selling rallies or buying some Dec puts at the money might be a trading idea.
E-mini Russell 2000 chart
posted by emacro @ 4:09 PM
0 comments
![]()
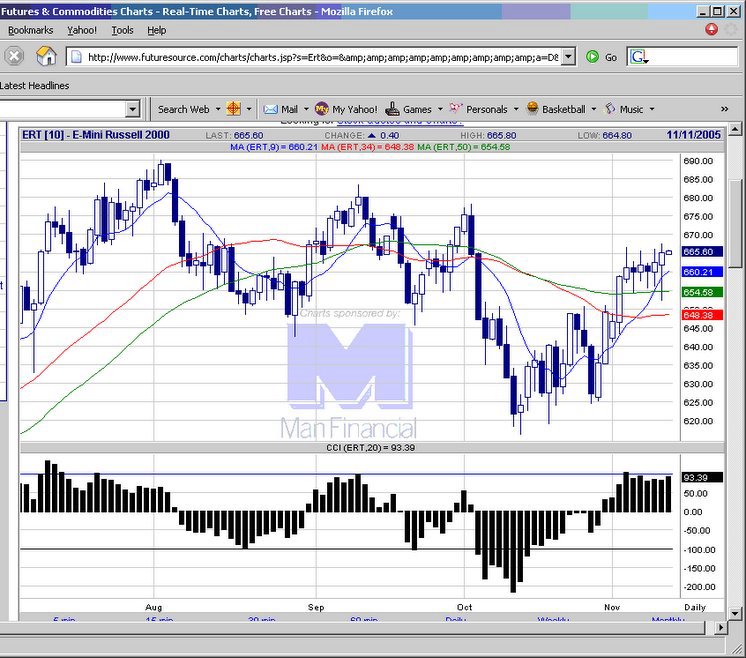
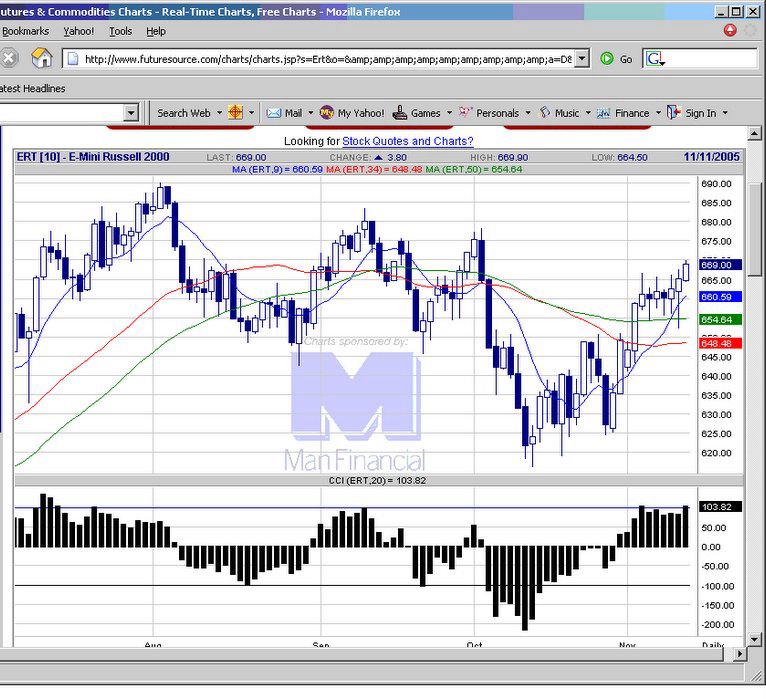 20051111 May be an opportunity to take s swing trade short next week short term. CCI has gone above +100 indicating strong momentum though.
E-mini Russell 2000 chart
20051111 May be an opportunity to take s swing trade short next week short term. CCI has gone above +100 indicating strong momentum though.
E-mini Russell 2000 chart
posted by emacro @ 5:57 PM
0 comments
![]()
posted by emacro @ 6:27 PM
0 comments
![]()
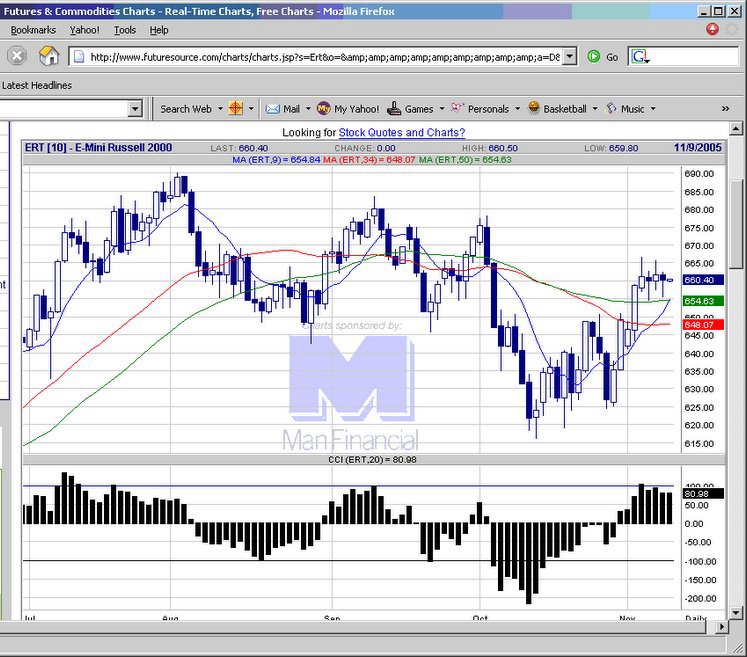
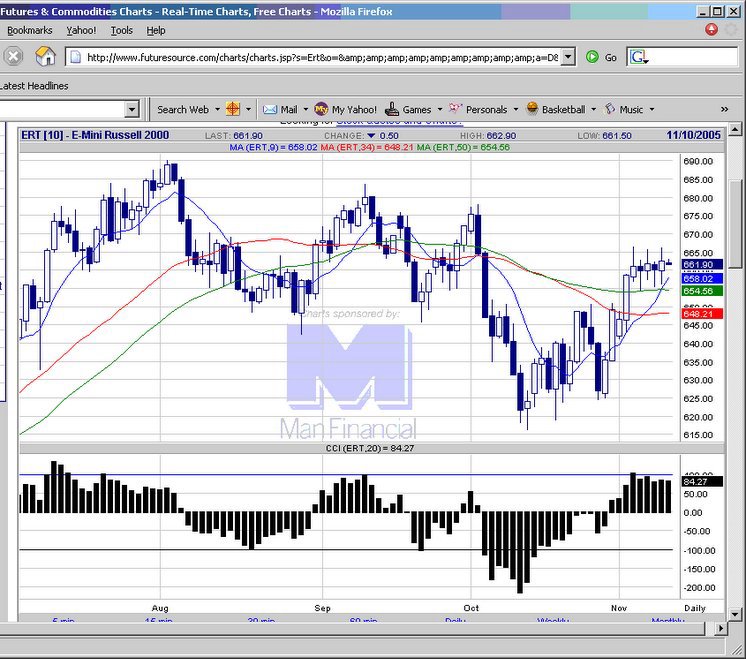 20051110 Still sideways action, some resistance, which if broken will see acceleration to upside. Below 654 could probe to test weak long stops.
E-mini Russell 2000 chart
20051110 Still sideways action, some resistance, which if broken will see acceleration to upside. Below 654 could probe to test weak long stops.
E-mini Russell 2000 chart
posted by emacro @ 11:18 PM
0 comments
![]()
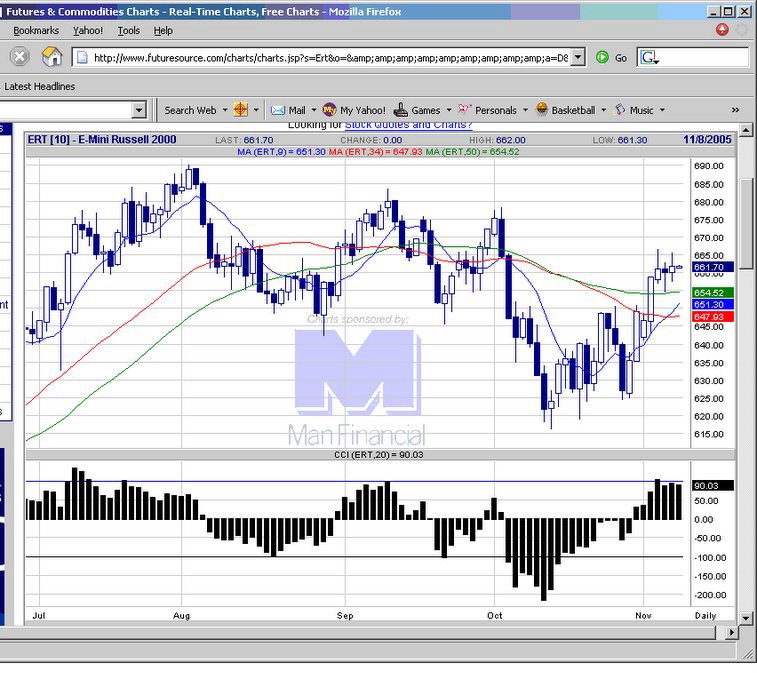
 20051108 Continues to consolidate strong gains. On balance shud be positive, but the price action willl confirm.
E-mini Russell 2000 chart
20051108 Continues to consolidate strong gains. On balance shud be positive, but the price action willl confirm.
E-mini Russell 2000 chart
posted by emacro @ 5:20 PM
0 comments
![]()
 20051107 Sideways pattern, consolidating gains, which if the highs break, would reinforce the bullish stance.
E-mini Russell 2000 chart
20051107 Sideways pattern, consolidating gains, which if the highs break, would reinforce the bullish stance.
E-mini Russell 2000 chart
posted by emacro @ 4:56 PM
0 comments
![]()
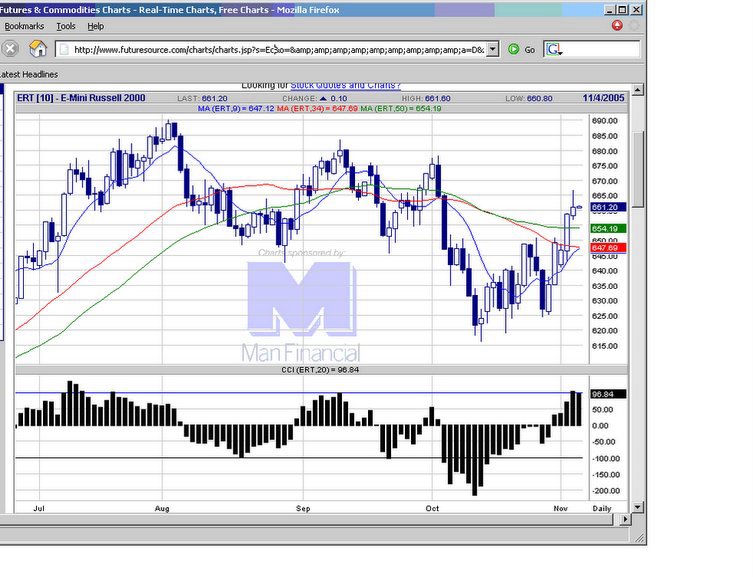
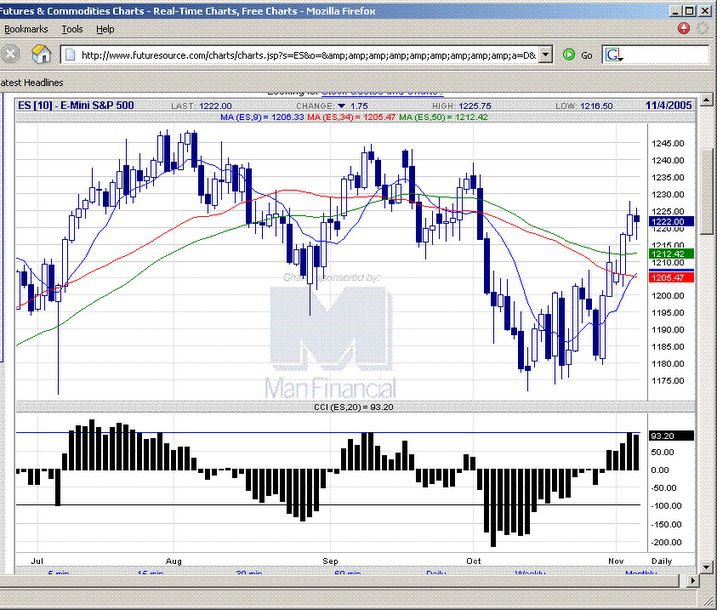 20051104 A respite frm the torrid upmove, with an ID pattern forming today. This indicates possibility of breakout trade either side If the break is down, then 1212 remains support for possible long, with good upside CCI momentum.
E-mini Russell 2000 chart
20051104 A respite frm the torrid upmove, with an ID pattern forming today. This indicates possibility of breakout trade either side If the break is down, then 1212 remains support for possible long, with good upside CCI momentum.
E-mini Russell 2000 chart
posted by emacro @ 4:44 PM
0 comments
![]()
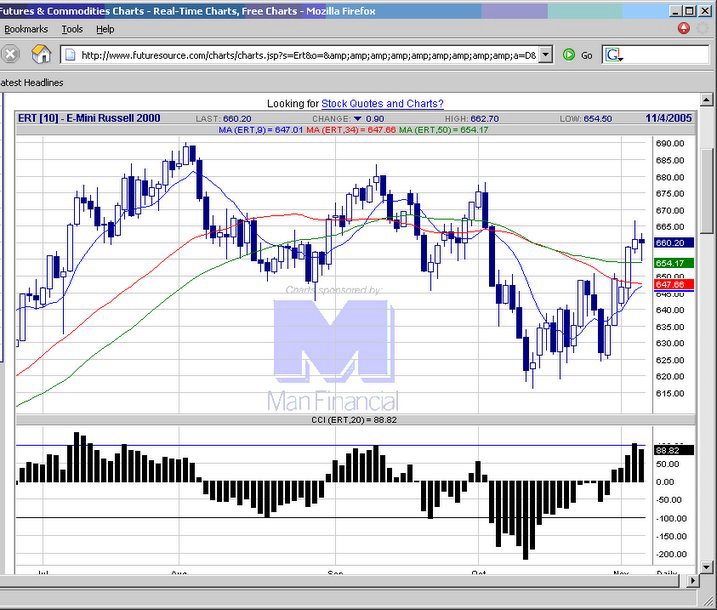 20051104 Weakness moved the Russell to 654, the mov avg level which ended up being a good level to buy to enter the current uptrend. CCI momentum still remains strong to upside.
E-mini Russell 2000 chart
20051104 Weakness moved the Russell to 654, the mov avg level which ended up being a good level to buy to enter the current uptrend. CCI momentum still remains strong to upside.
E-mini Russell 2000 chart
posted by emacro @ 4:42 PM
0 comments
![]()
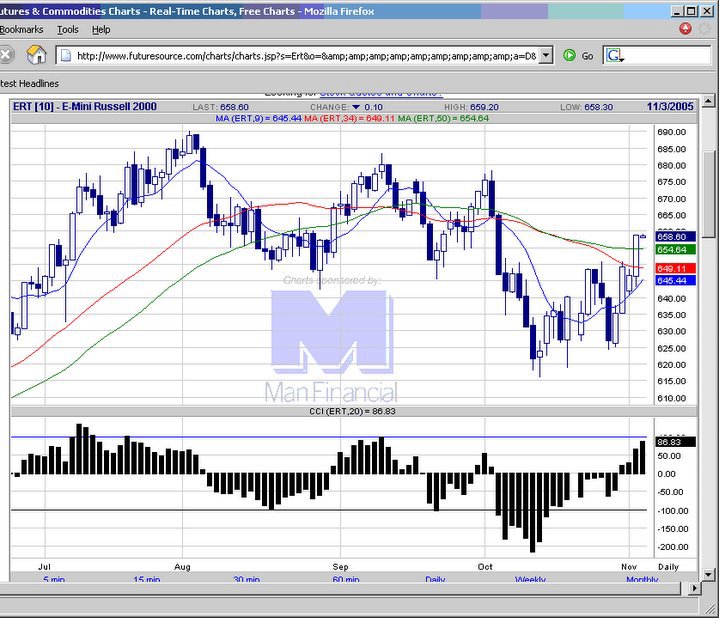
 20051103 Loking for the moving averages for buying support. CCI momentum is still strong, but the candlestick shows signs of some selling, which could be due to profit taking.
E-mini Russell 2000 chart
20051103 Loking for the moving averages for buying support. CCI momentum is still strong, but the candlestick shows signs of some selling, which could be due to profit taking.
E-mini Russell 2000 chart
posted by emacro @ 4:43 PM
0 comments
![]()
 20051102 Russell broke out of the ID pattern and the mov avg level 649 with a powerful upside move through the resistance levels. Should be on the lookout for intraday moves back down to enter the uptrend.
E-mini Russell 2000 chart
20051102 Russell broke out of the ID pattern and the mov avg level 649 with a powerful upside move through the resistance levels. Should be on the lookout for intraday moves back down to enter the uptrend.
E-mini Russell 2000 chart
posted by emacro @ 4:03 PM
0 comments
![]()