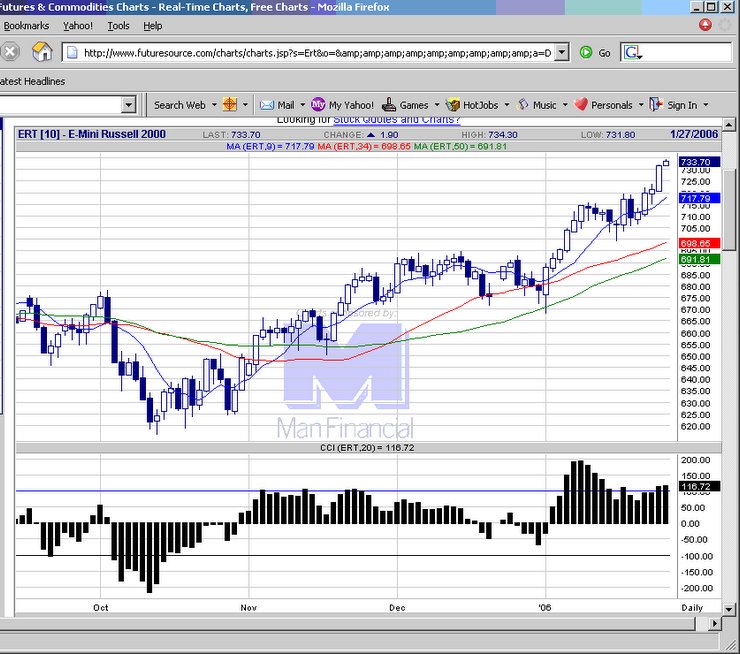
 20060126 Russell 2000 proved to be the strongest US index, breaking out in parabolic fashion. So it seems this is the market leader up.
  E-mini Russell 2000 chart
posted by emacro @ 4:54 PM
0 comments
![]()
Since 2004, the e-mini Russell 2000 futures has emerged as one of the favourite trading vehicle. It has advantages of providing cover and exposure to the small cap sector of the US equity markets, in addition to good volatility and intraday and interday trending characteristics. This educatinal site will chronicle trading in the contract.
20060126 Russell 2000 proved to be the strongest US index, breaking out in parabolic fashion. So it seems this is the market leader up.
E-mini Russell 2000 chart
posted by emacro @ 4:54 PM
0 comments
![]()
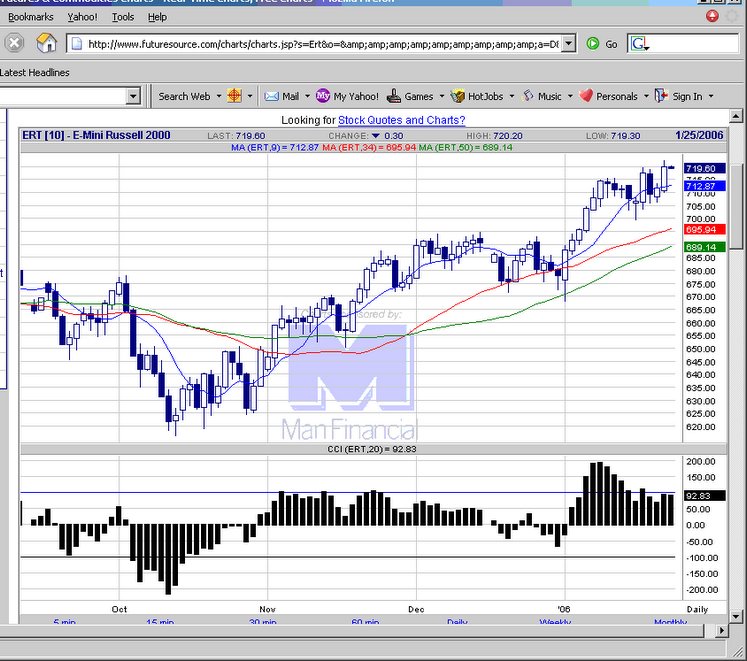
 20060125 Makes another al time high, but candlestick shows tussle between bulls and bears. With the S&P500 possibility of continuation pattern down, which index is right? Time will tell. But we also see a little divergence here.
E-mini Russell 2000 chart
20060125 Makes another al time high, but candlestick shows tussle between bulls and bears. With the S&P500 possibility of continuation pattern down, which index is right? Time will tell. But we also see a little divergence here.
E-mini Russell 2000 chart
posted by emacro @ 3:56 PM
0 comments
![]()
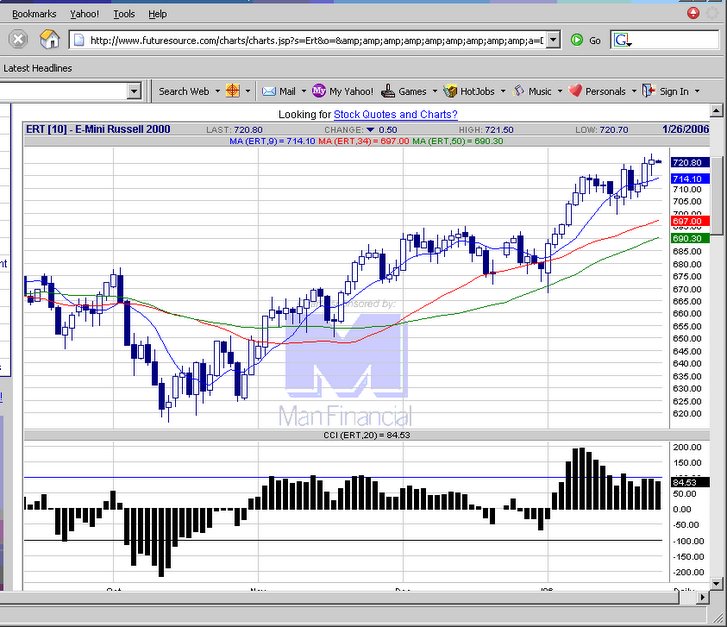
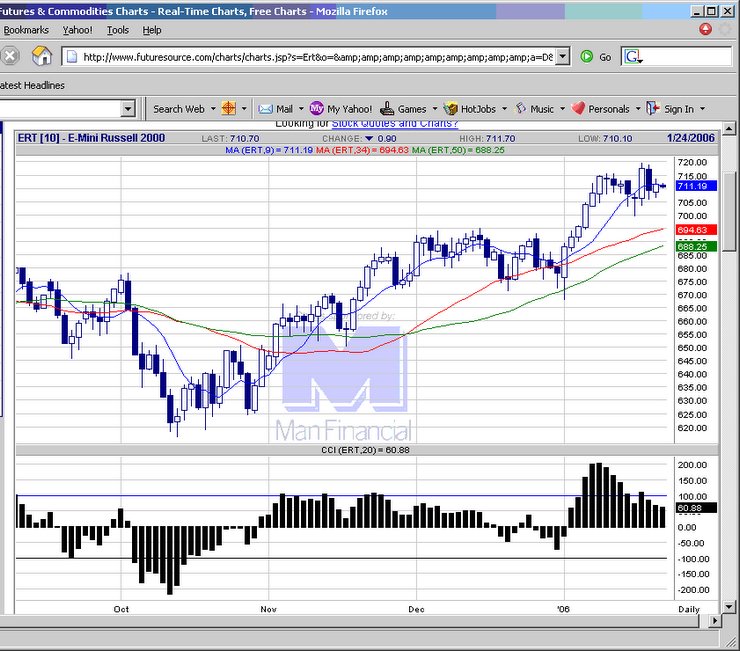
 2006024 Rusell 2000 make all time highs, outperforming all the 3 other major indices. Watching for the turtle sop reversal possibly.
E-mini Russell 2000 chart
2006024 Rusell 2000 make all time highs, outperforming all the 3 other major indices. Watching for the turtle sop reversal possibly.
E-mini Russell 2000 chart
posted by emacro @ 4:32 PM
0 comments
![]()
 20060123 Russell 2000 remains the stronget of the US stock indices technically.
E-mini Russell 2000 chart
20060123 Russell 2000 remains the stronget of the US stock indices technically.
E-mini Russell 2000 chart
posted by emacro @ 4:38 PM
0 comments
![]()
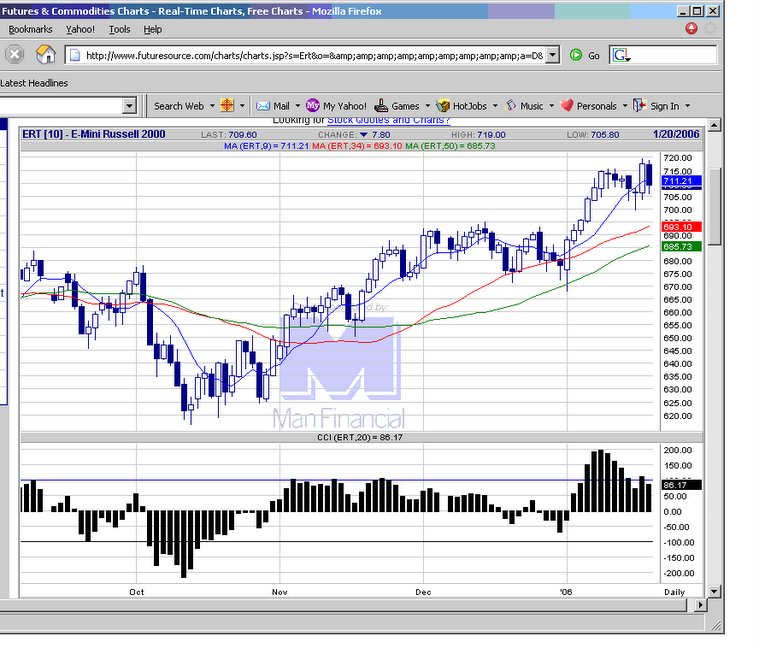 20060120 Russell 2000 shows resilience in the face of the falls in the Dow, Nasdaq and S&P 500.(due to earnings concerns from GE Citigroup results) Could be that the options expiration aggravated the falls in the bigger cap indices.
E-mini Russell 2000 chart
20060120 Russell 2000 shows resilience in the face of the falls in the Dow, Nasdaq and S&P 500.(due to earnings concerns from GE Citigroup results) Could be that the options expiration aggravated the falls in the bigger cap indices.
E-mini Russell 2000 chart
posted by emacro @ 5:37 PM
1 comments
![]()
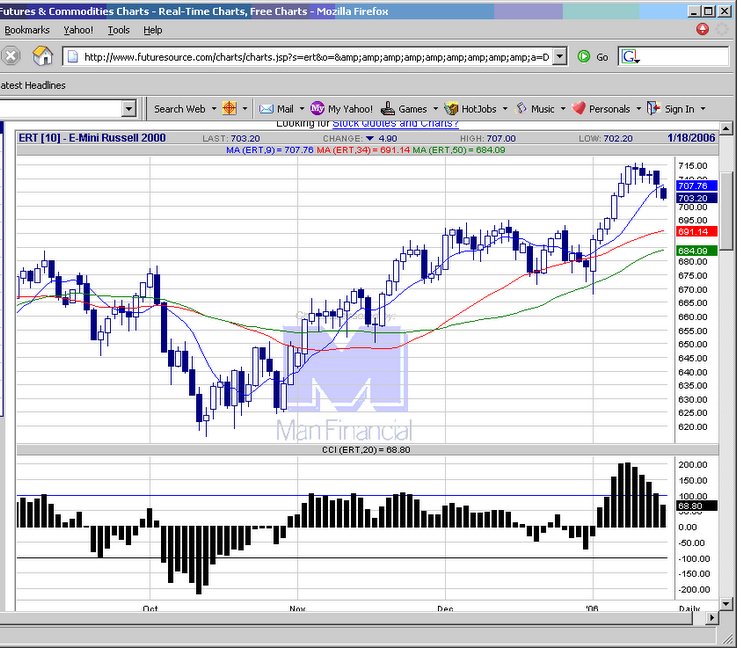
 20060118 A hammer formation which could signal a reversal of this corrective move.
E-mini Russell 2000 chart
20060118 A hammer formation which could signal a reversal of this corrective move.
E-mini Russell 2000 chart
posted by emacro @ 4:03 PM
0 comments
![]()
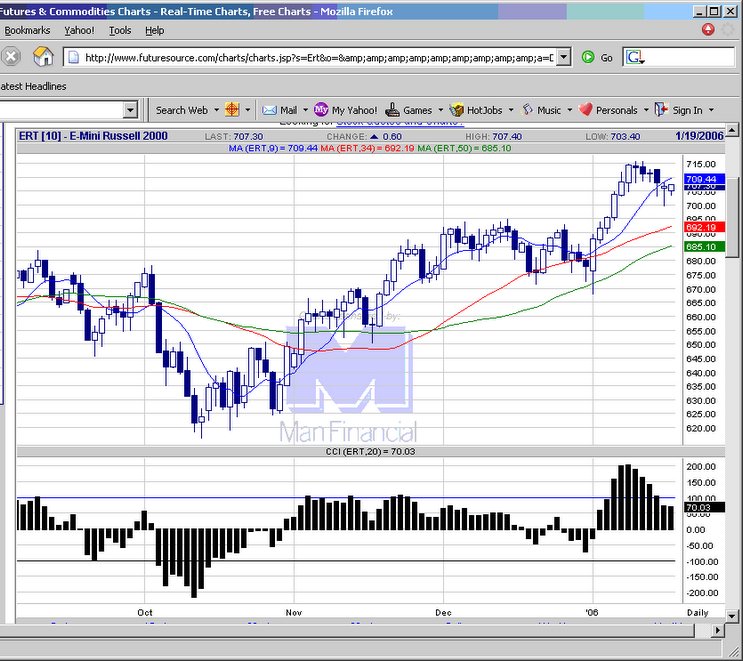
 20060117 Russell futures had been resiliently scribing the range. With the breakdown out of it today, looks like heading towards the next mov avg support.
E-mini Russell 2000 chart
20060117 Russell futures had been resiliently scribing the range. With the breakdown out of it today, looks like heading towards the next mov avg support.
E-mini Russell 2000 chart
posted by emacro @ 4:55 PM
0 comments
![]()
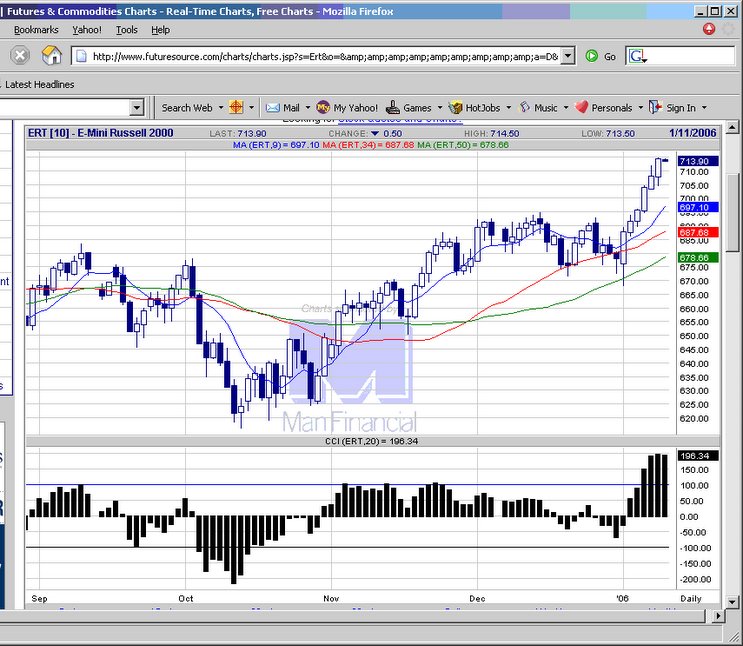
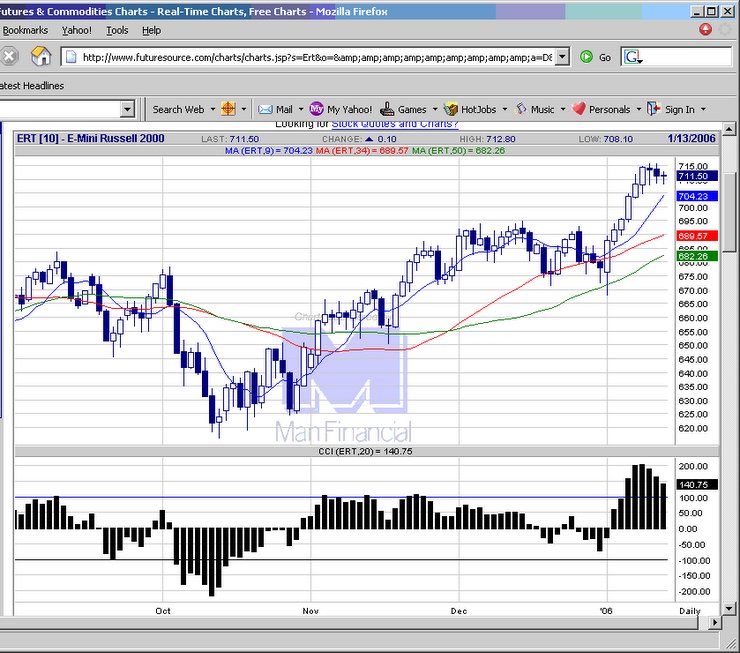 20060113 Russell 2000 remains most resilient of the major stock indices. Still scribing a sideways consolidation (bullish) despite the Dow and S&P 500 correcting. Will be interesting to see who is leading: small or big cap stocks.
E-mini Russell 2000 chart
20060113 Russell 2000 remains most resilient of the major stock indices. Still scribing a sideways consolidation (bullish) despite the Dow and S&P 500 correcting. Will be interesting to see who is leading: small or big cap stocks.
E-mini Russell 2000 chart
posted by emacro @ 7:27 PM
0 comments
![]()
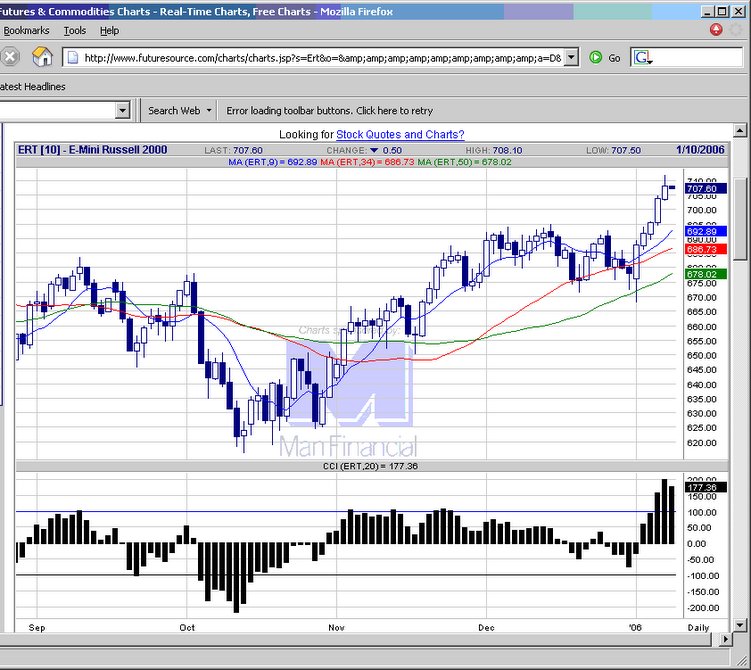
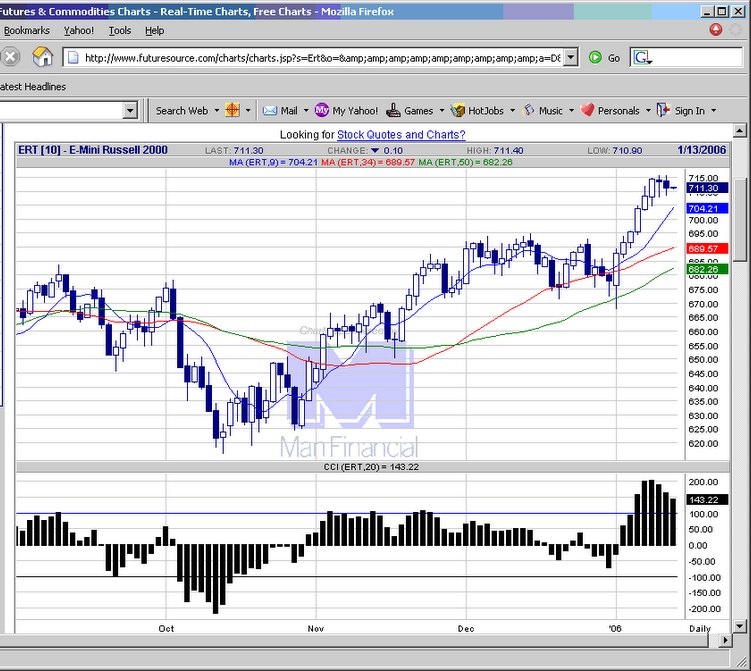 20060112 Down candlestick=selling. But overall pattern is sideways. Watching if it reverses in a evening star formation.
E-mini Russell 2000 chart
20060112 Down candlestick=selling. But overall pattern is sideways. Watching if it reverses in a evening star formation.
E-mini Russell 2000 chart
posted by emacro @ 5:18 PM
0 comments
![]()
posted by emacro @ 9:34 PM
0 comments
![]()
posted by emacro @ 4:58 PM
0 comments
![]()
posted by emacro @ 6:20 PM
0 comments
![]()
posted by emacro @ 4:00 PM
0 comments
![]()
posted by emacro @ 4:21 PM
0 comments
![]()
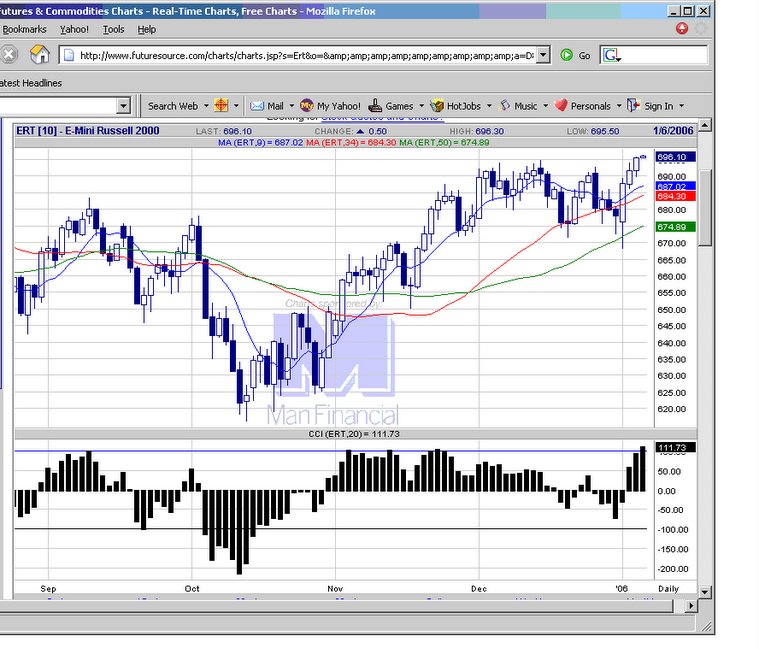
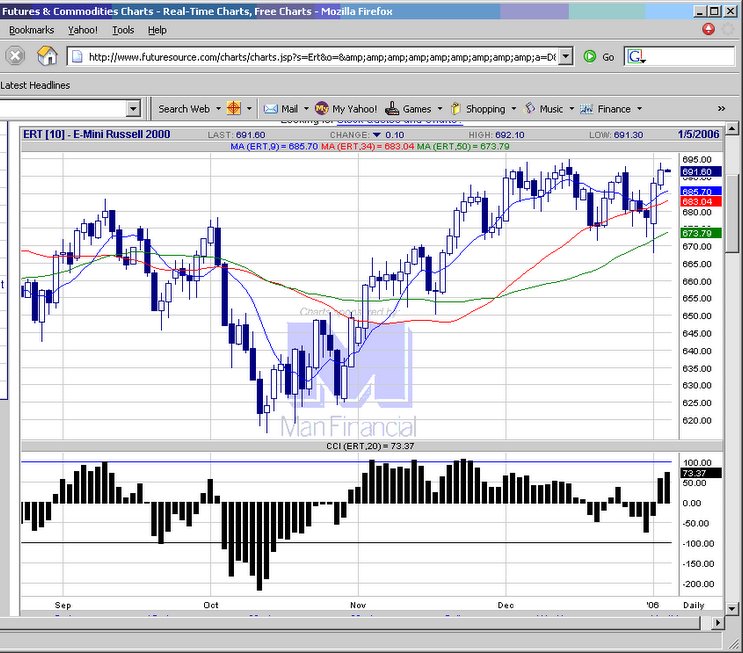
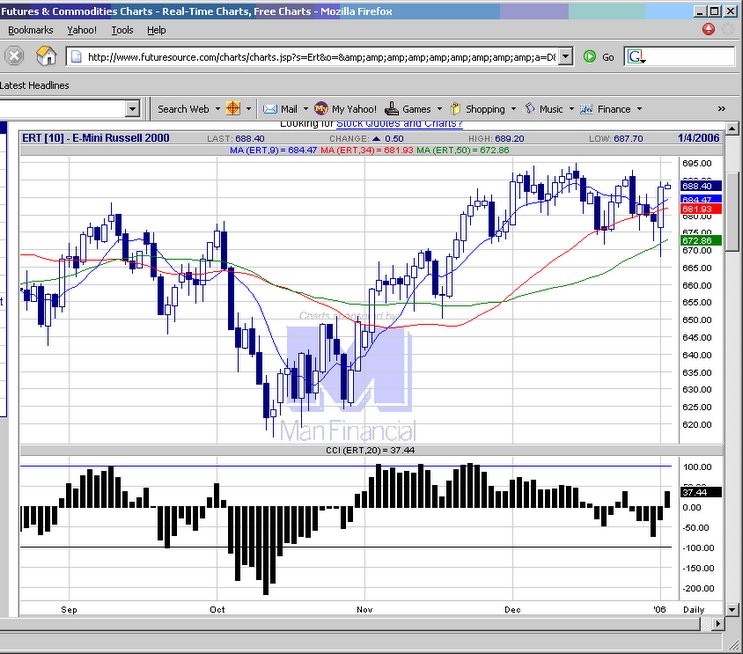 20060103 An early sell off in reaction to worse than expected construction spending numbers was followed by rally sparked by the FOMC mnutes release. 672.8, the 50 ema level proved to be valid support, where the bounce came off that level. CCI strong, but a little overbought.
E-mini Russell 2000 chart
20060103 An early sell off in reaction to worse than expected construction spending numbers was followed by rally sparked by the FOMC mnutes release. 672.8, the 50 ema level proved to be valid support, where the bounce came off that level. CCI strong, but a little overbought.
E-mini Russell 2000 chart
posted by emacro @ 4:05 PM
0 comments
![]()