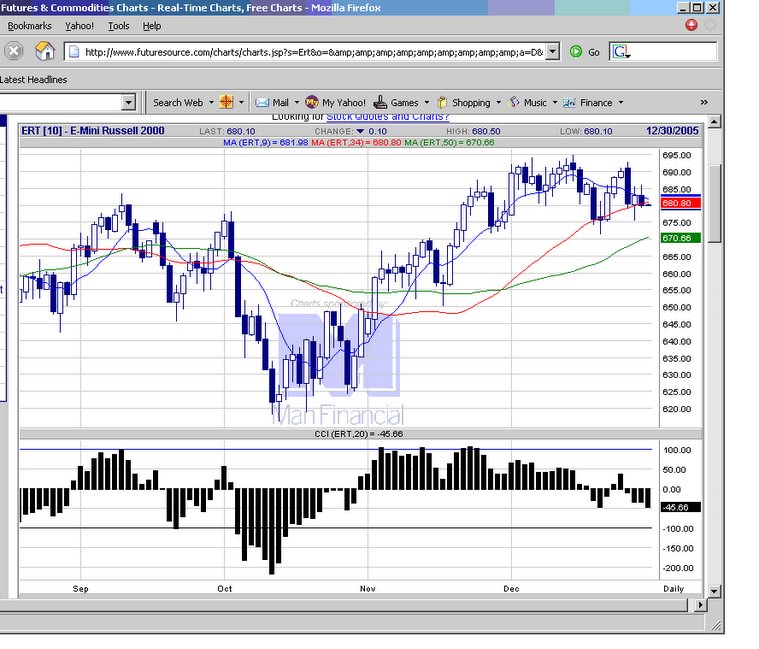
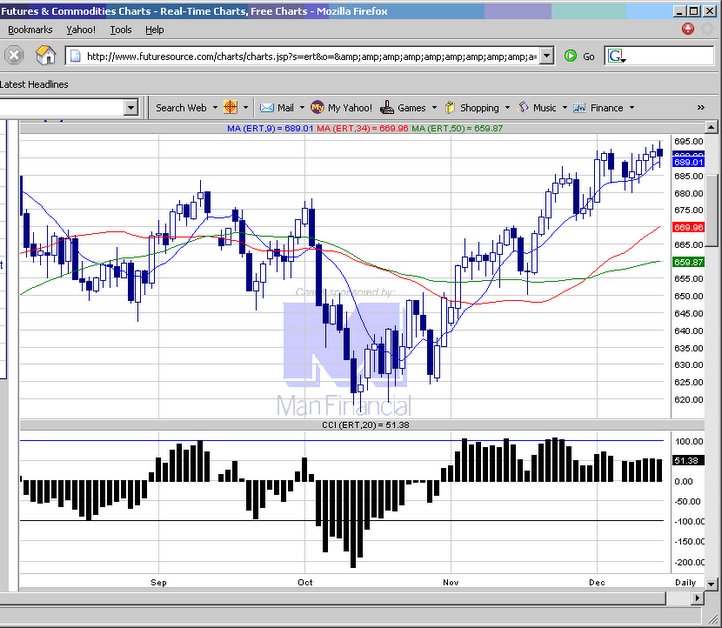
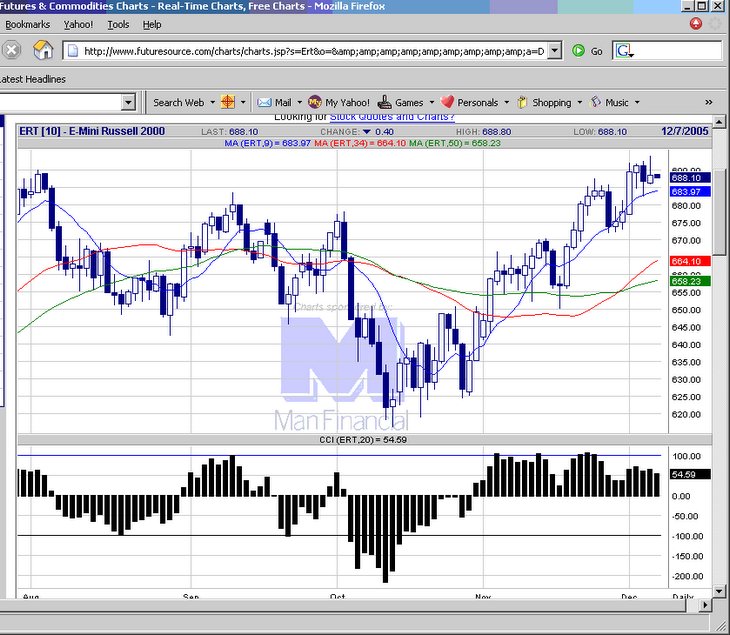
20051230 Negative CCI momentum, but the candlestick shows buyers preventing bears from taking control.
  E-mini Russell 2000 chart
posted by emacro @ 7:23 PM
0 comments
![]()
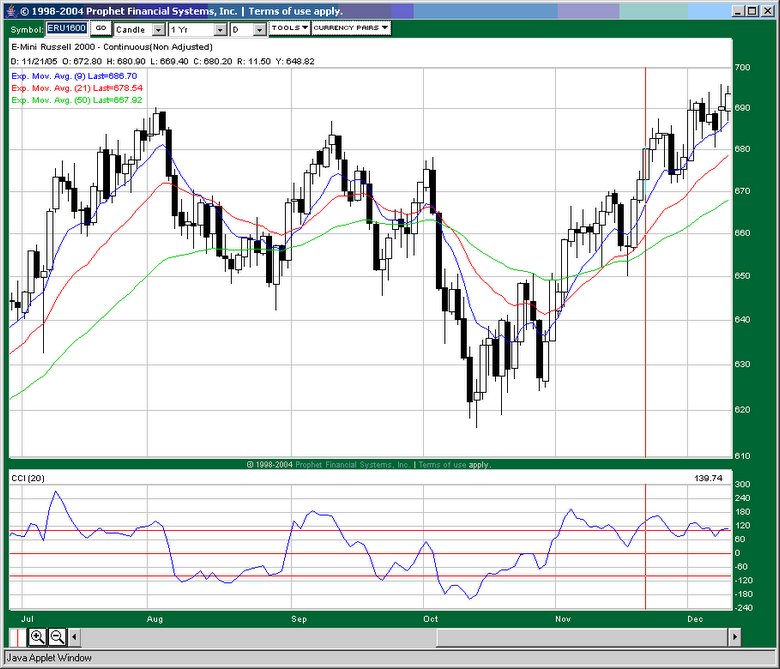
Since 2004, the e-mini Russell 2000 futures has emerged as one of the favourite trading vehicle. It has advantages of providing cover and exposure to the small cap sector of the US equity markets, in addition to good volatility and intraday and interday trending characteristics. This educatinal site will chronicle trading in the contract.
20051230 Negative CCI momentum, but the candlestick shows buyers preventing bears from taking control.
E-mini Russell 2000 chart
posted by emacro @ 7:23 PM
0 comments
![]()
 20051228 Finding some support off the mov avg. However the CCI pattern along the zero line indicates sideways action in a big range.
E-mini Russell 2000 chart
20051228 Finding some support off the mov avg. However the CCI pattern along the zero line indicates sideways action in a big range.
E-mini Russell 2000 chart
posted by emacro @ 5:11 PM
0 comments
![]()
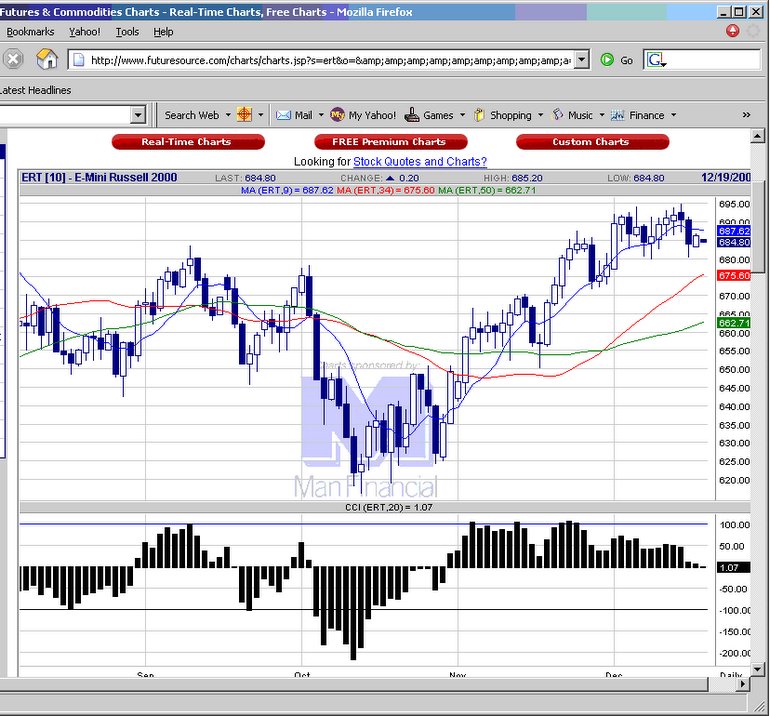
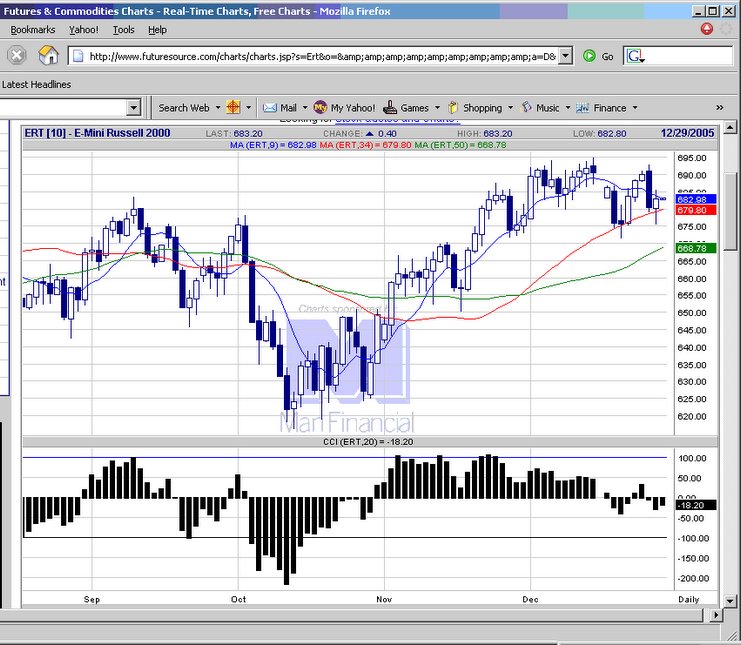
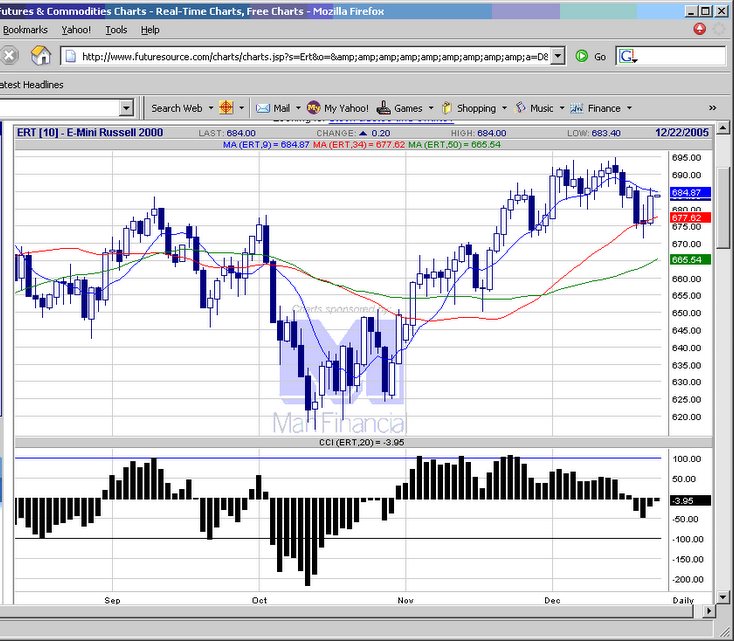
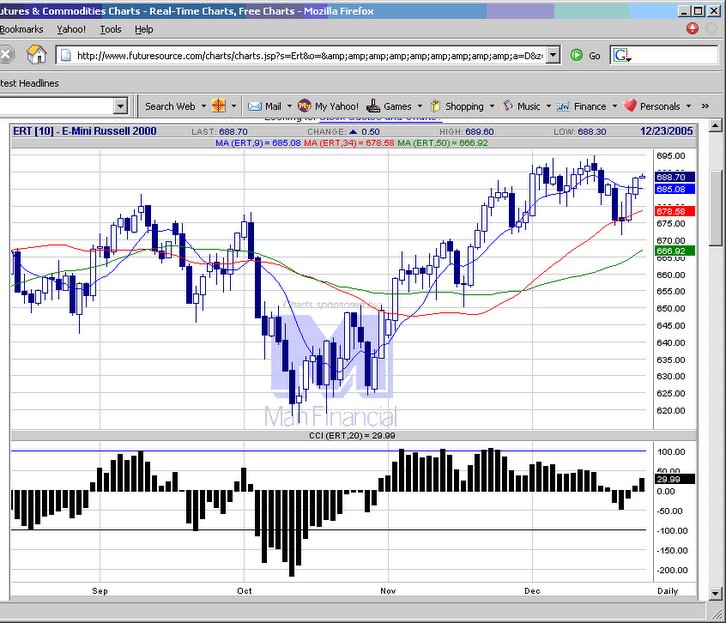 20051222 A rally sparked by the agreement by transport workers to go back to work in NY. CCI shows classic ZLR buy signal, with break through of upside moving average resistance.
E-mini Russell 2000 chart
20051222 A rally sparked by the agreement by transport workers to go back to work in NY. CCI shows classic ZLR buy signal, with break through of upside moving average resistance.
E-mini Russell 2000 chart
posted by emacro @ 7:52 PM
0 comments
![]()
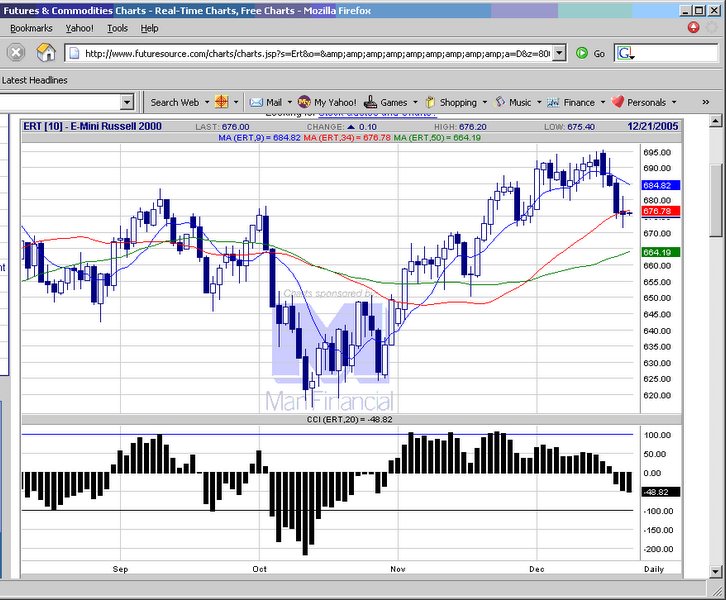
 20051221 Russell bounced off nicely from the moving average support, now hitting against upper mov avg. With the holiday trading mood, could be stuck in this range.
E-mini Russell 2000 chart
20051221 Russell bounced off nicely from the moving average support, now hitting against upper mov avg. With the holiday trading mood, could be stuck in this range.
E-mini Russell 2000 chart
posted by emacro @ 6:45 PM
0 comments
![]()
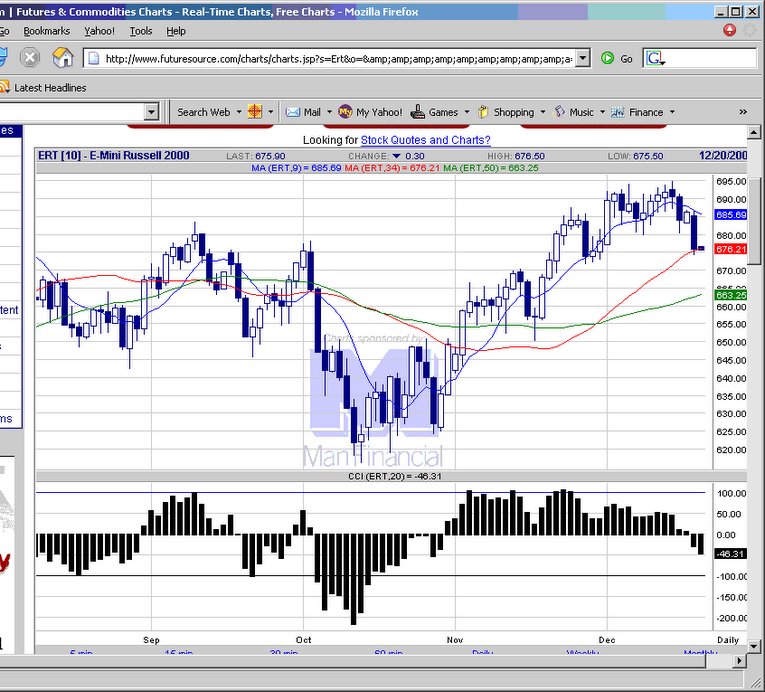
 20051220 Market holding moving average support, doji indicates indecisiveness, possibly building up energy for the next move.
E-mini Russell 2000 chart
20051220 Market holding moving average support, doji indicates indecisiveness, possibly building up energy for the next move.
E-mini Russell 2000 chart
posted by emacro @ 3:54 PM
0 comments
![]()
posted by emacro @ 5:12 PM
0 comments
![]()
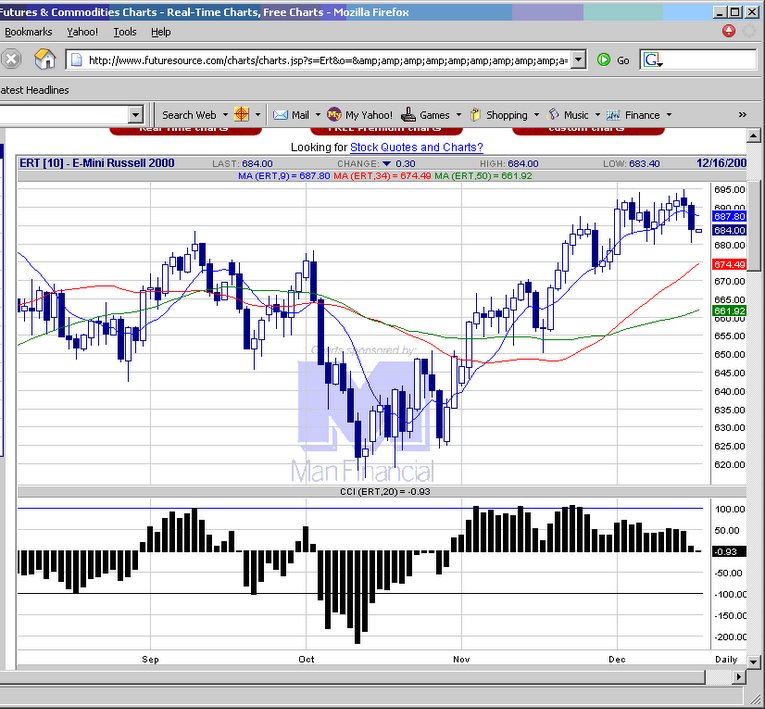
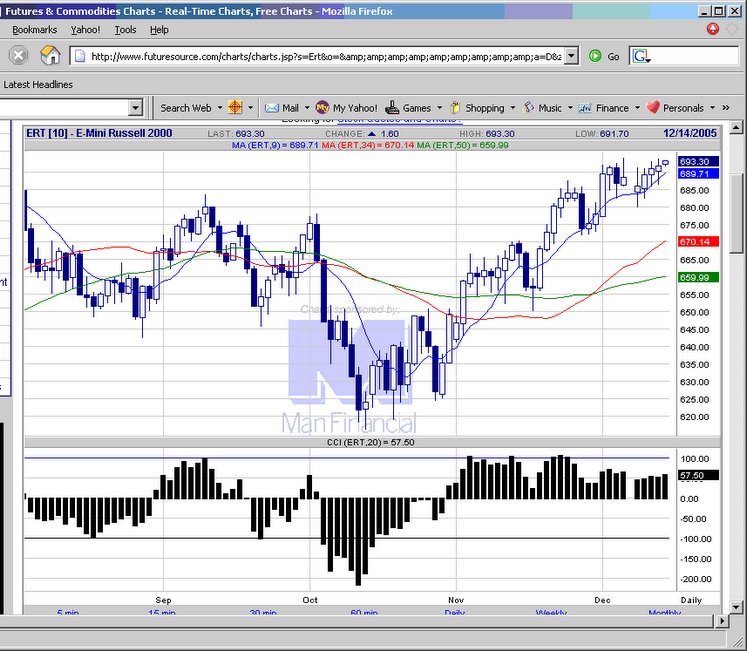
 20051214 Russell 2000 futures pauses today in the uptrend. Dow & S&P 500 end up though.
E-mini Russell 2000 chart
20051214 Russell 2000 futures pauses today in the uptrend. Dow & S&P 500 end up though.
E-mini Russell 2000 chart
posted by emacro @ 4:09 PM
0 comments
![]()
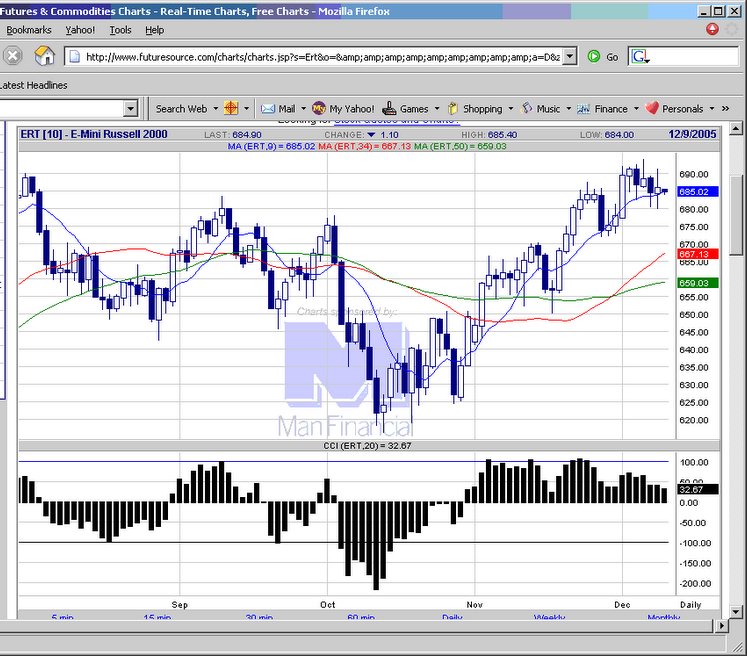
 20051213 FOMC meeting raises 25 bp for interest rates, but change in policy statement in focus on the word "accomodative". Uptrend continues.
E-mini Russell 2000 chart
20051213 FOMC meeting raises 25 bp for interest rates, but change in policy statement in focus on the word "accomodative". Uptrend continues.
E-mini Russell 2000 chart
posted by emacro @ 6:37 PM
0 comments
![]()
posted by emacro @ 7:32 PM
0 comments
![]()
 2005208 Could be forming a triangle for the breakout soon. CCI momentum indicating this could be on the upside.
E-mini Russell 2000 chart
2005208 Could be forming a triangle for the breakout soon. CCI momentum indicating this could be on the upside.
E-mini Russell 2000 chart
posted by emacro @ 7:24 PM
0 comments
![]()
 2005206 Made a new high, but unable to sustain gains. Not a good sign, although still sideways action.
E-mini Russell 2000 chart
2005206 Made a new high, but unable to sustain gains. Not a good sign, although still sideways action.
E-mini Russell 2000 chart
posted by emacro @ 3:54 PM
0 comments
![]()
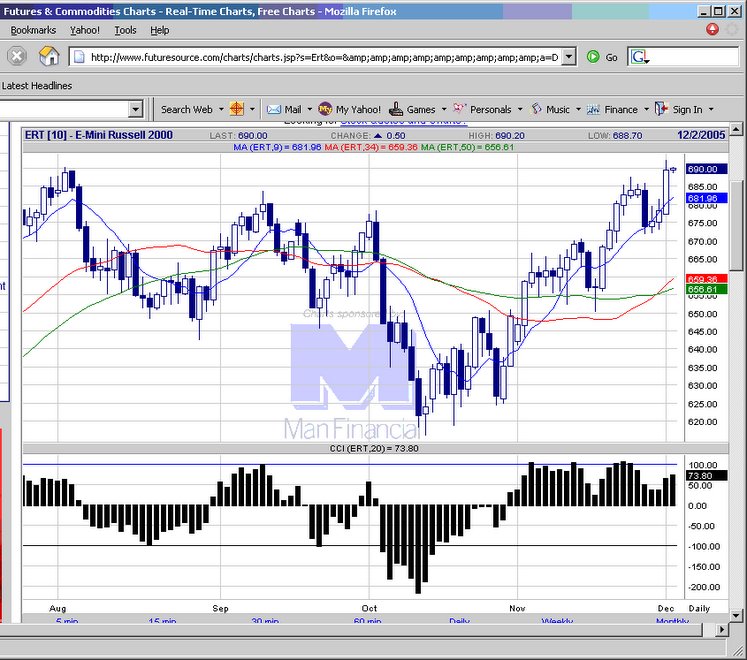 20051201 ZLR indicates buy signal on the CCI. New highs made signal continuation and confirmation of uptrend.
E-mini Russell 2000 chart
20051201 ZLR indicates buy signal on the CCI. New highs made signal continuation and confirmation of uptrend.
E-mini Russell 2000 chart
posted by emacro @ 11:42 PM
0 comments
![]()
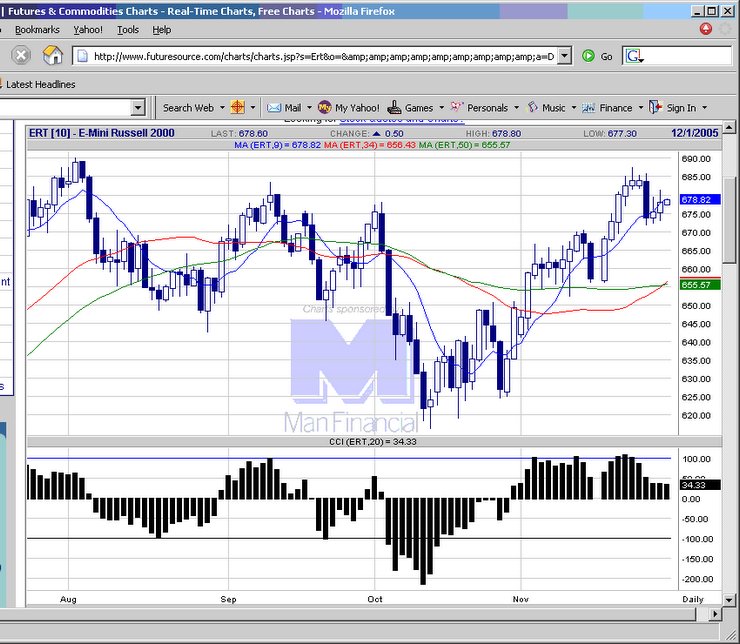 20051130 Sideways after the sell off 3 days ago. Could be setting up for another down move, where position traders can look to long on a 2 step corrective pattern to climb aboard the bull.
E-mini Russell 2000 chart
20051130 Sideways after the sell off 3 days ago. Could be setting up for another down move, where position traders can look to long on a 2 step corrective pattern to climb aboard the bull.
E-mini Russell 2000 chart
posted by emacro @ 1:53 AM
0 comments
![]()